Analytics Report for FSM
The Analytics Report for FSM in DreamzCMMS provides detailed insights into your field service operations. This guide walks you through how to access, configure, and filter your FSM analytics data to generate meaningful reports and drill down into specific statuses.
Overview
The FSM Analytics Panel allows administrators and managers to access and configure data filters to generate tailored reports. Using the available filter options — including date ranges, document types, and user email filters — you can narrow down data scope for precise analysis. The FSM Status Report gives a visual breakdown of job statuses, and individual data points can be drilled into for further detail.
Here is a reference video:
Steps to Access and Configure the FSM Analytics Report
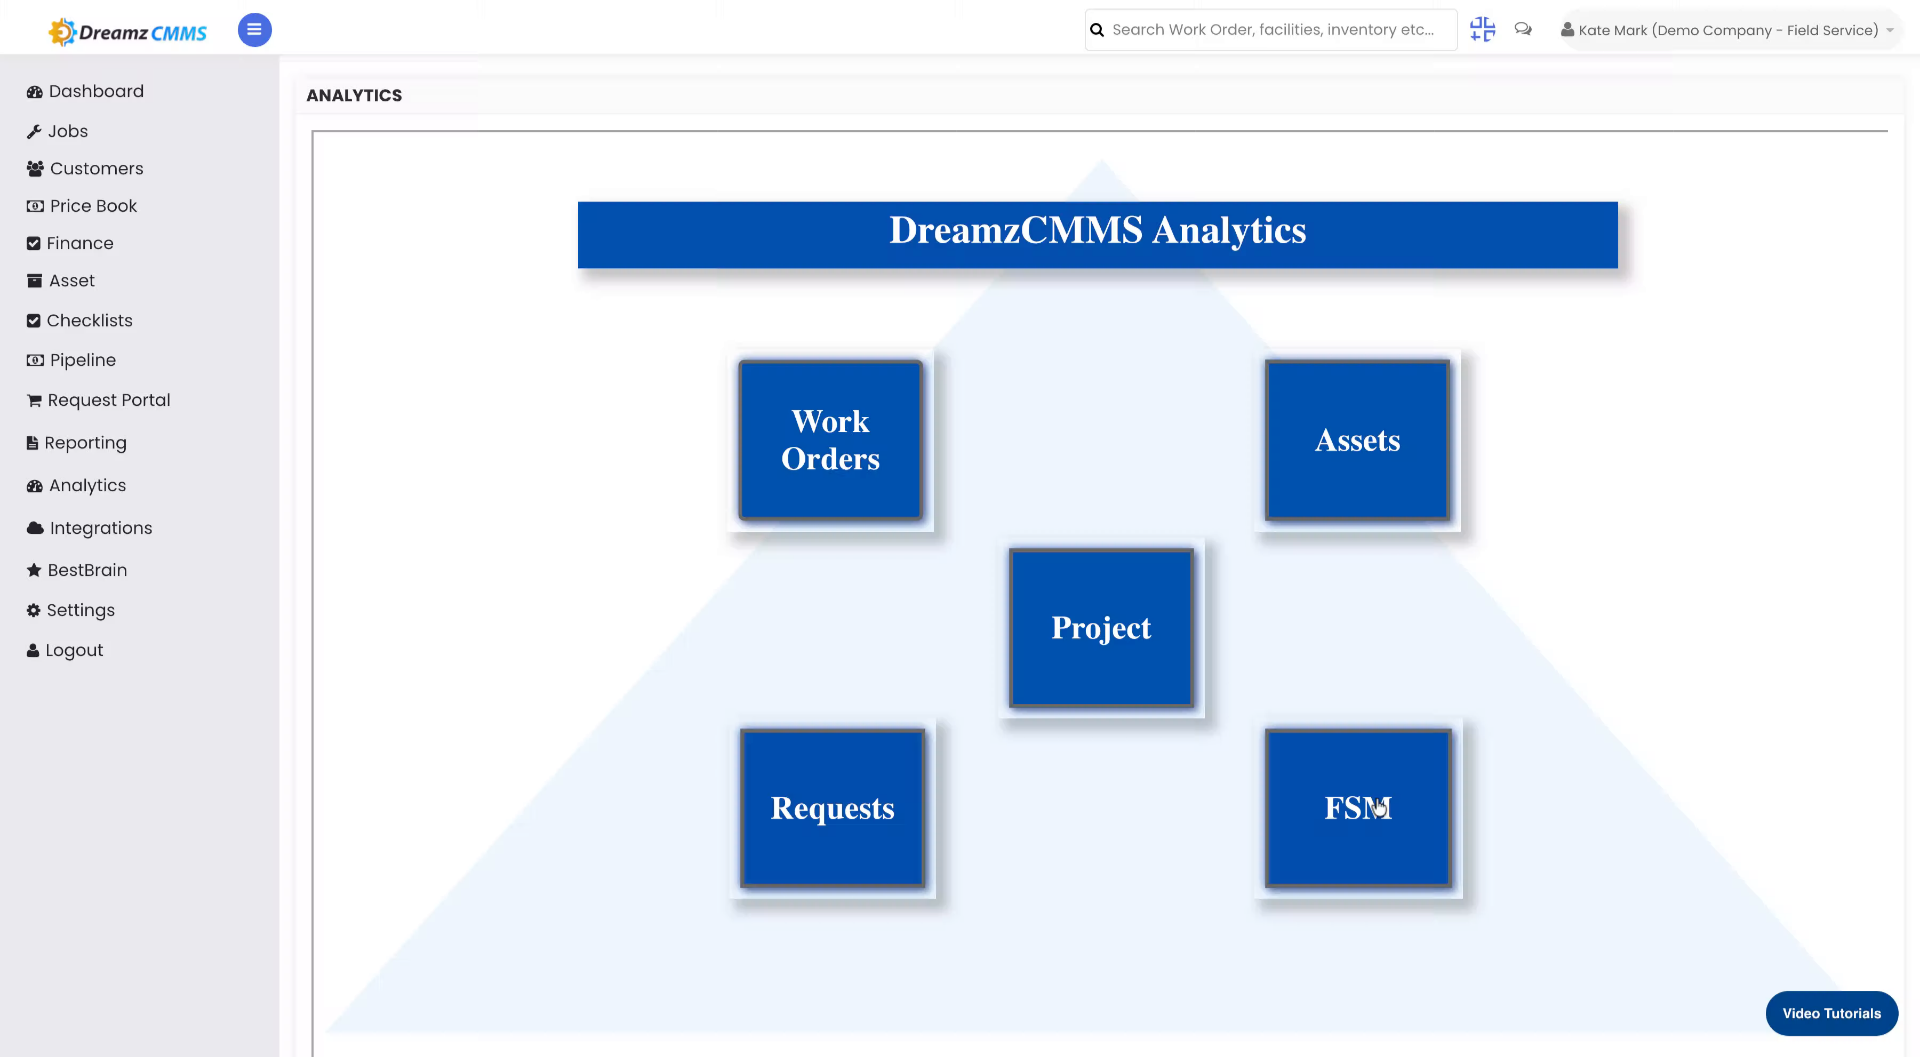
Step 01 – Analytics Report for FSM
This analytics data guides you through the FSM report. Navigate to the Analytics section within DreamzCMMS to get started.
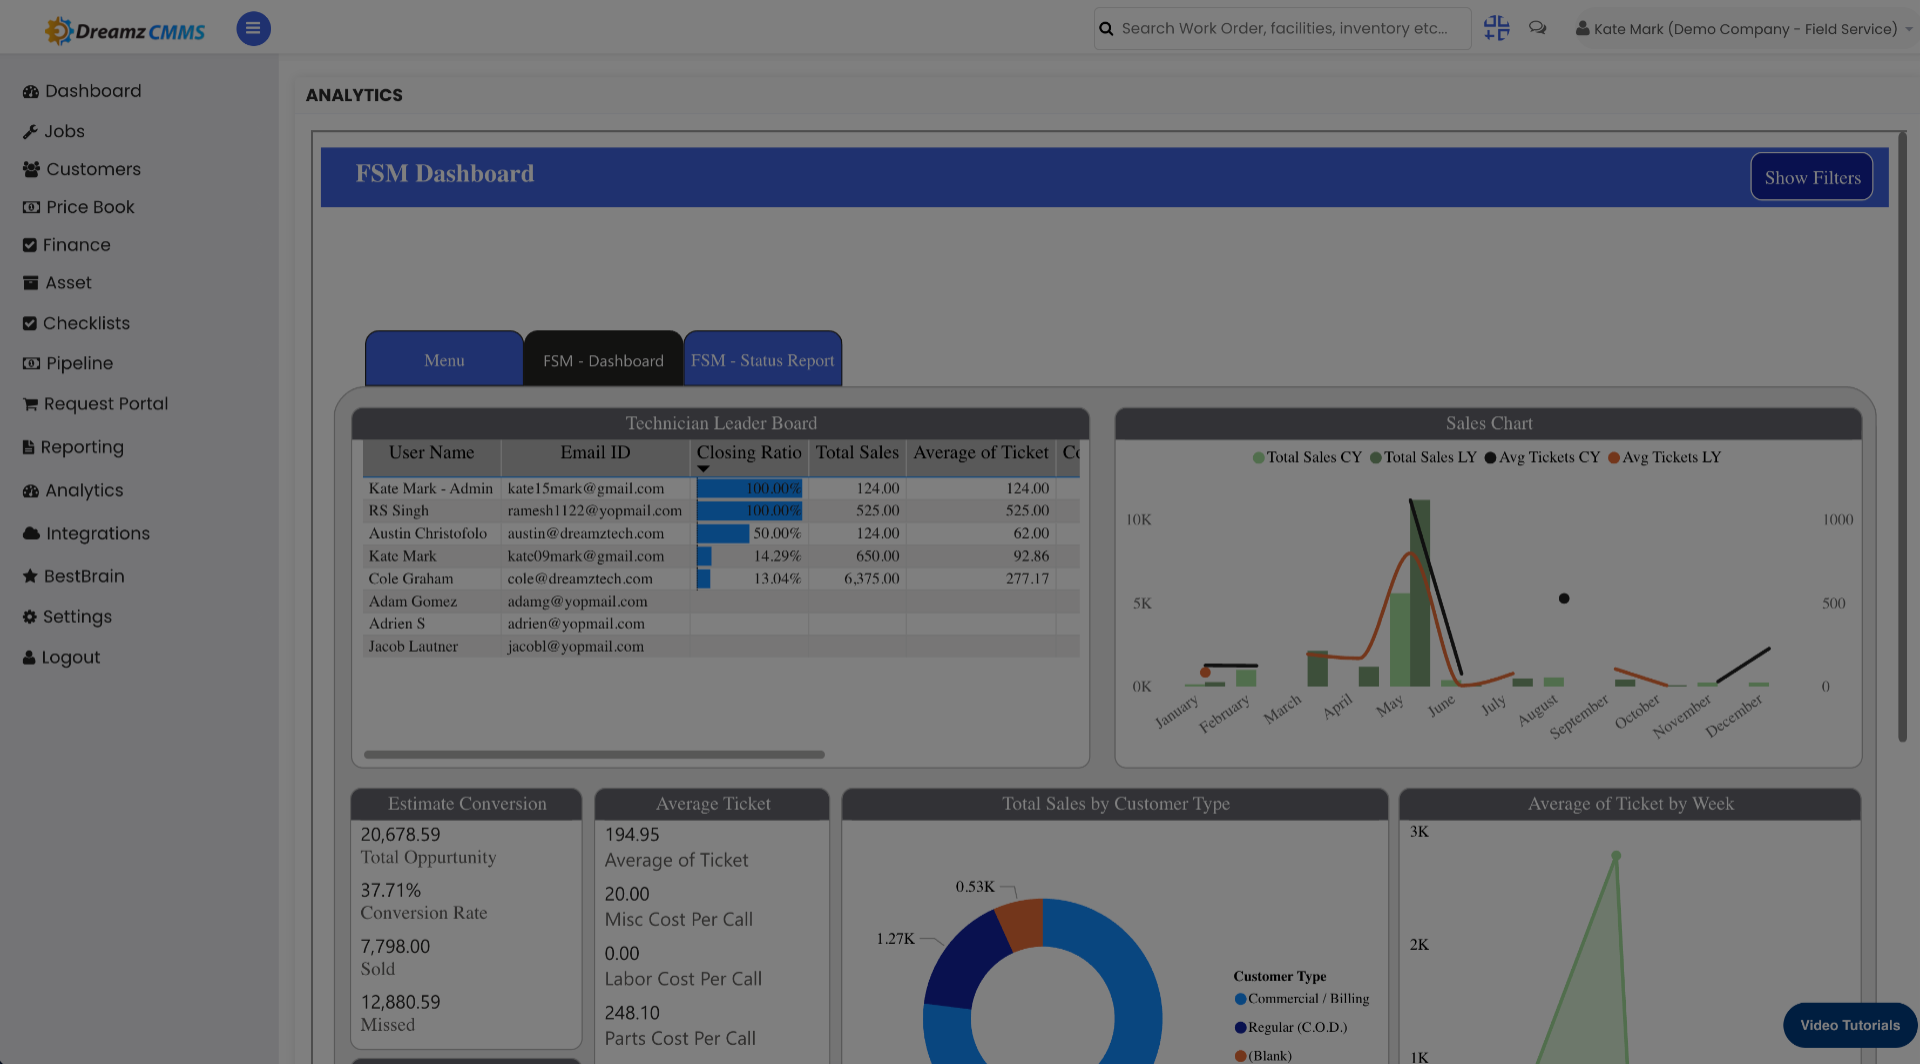
Step 02 – Open Analytics Panel
Click the Analytics panel to begin configuring your data filters.
Step 03 – Access Filter Options
Click the filter options to view available filtering criteria for your report.
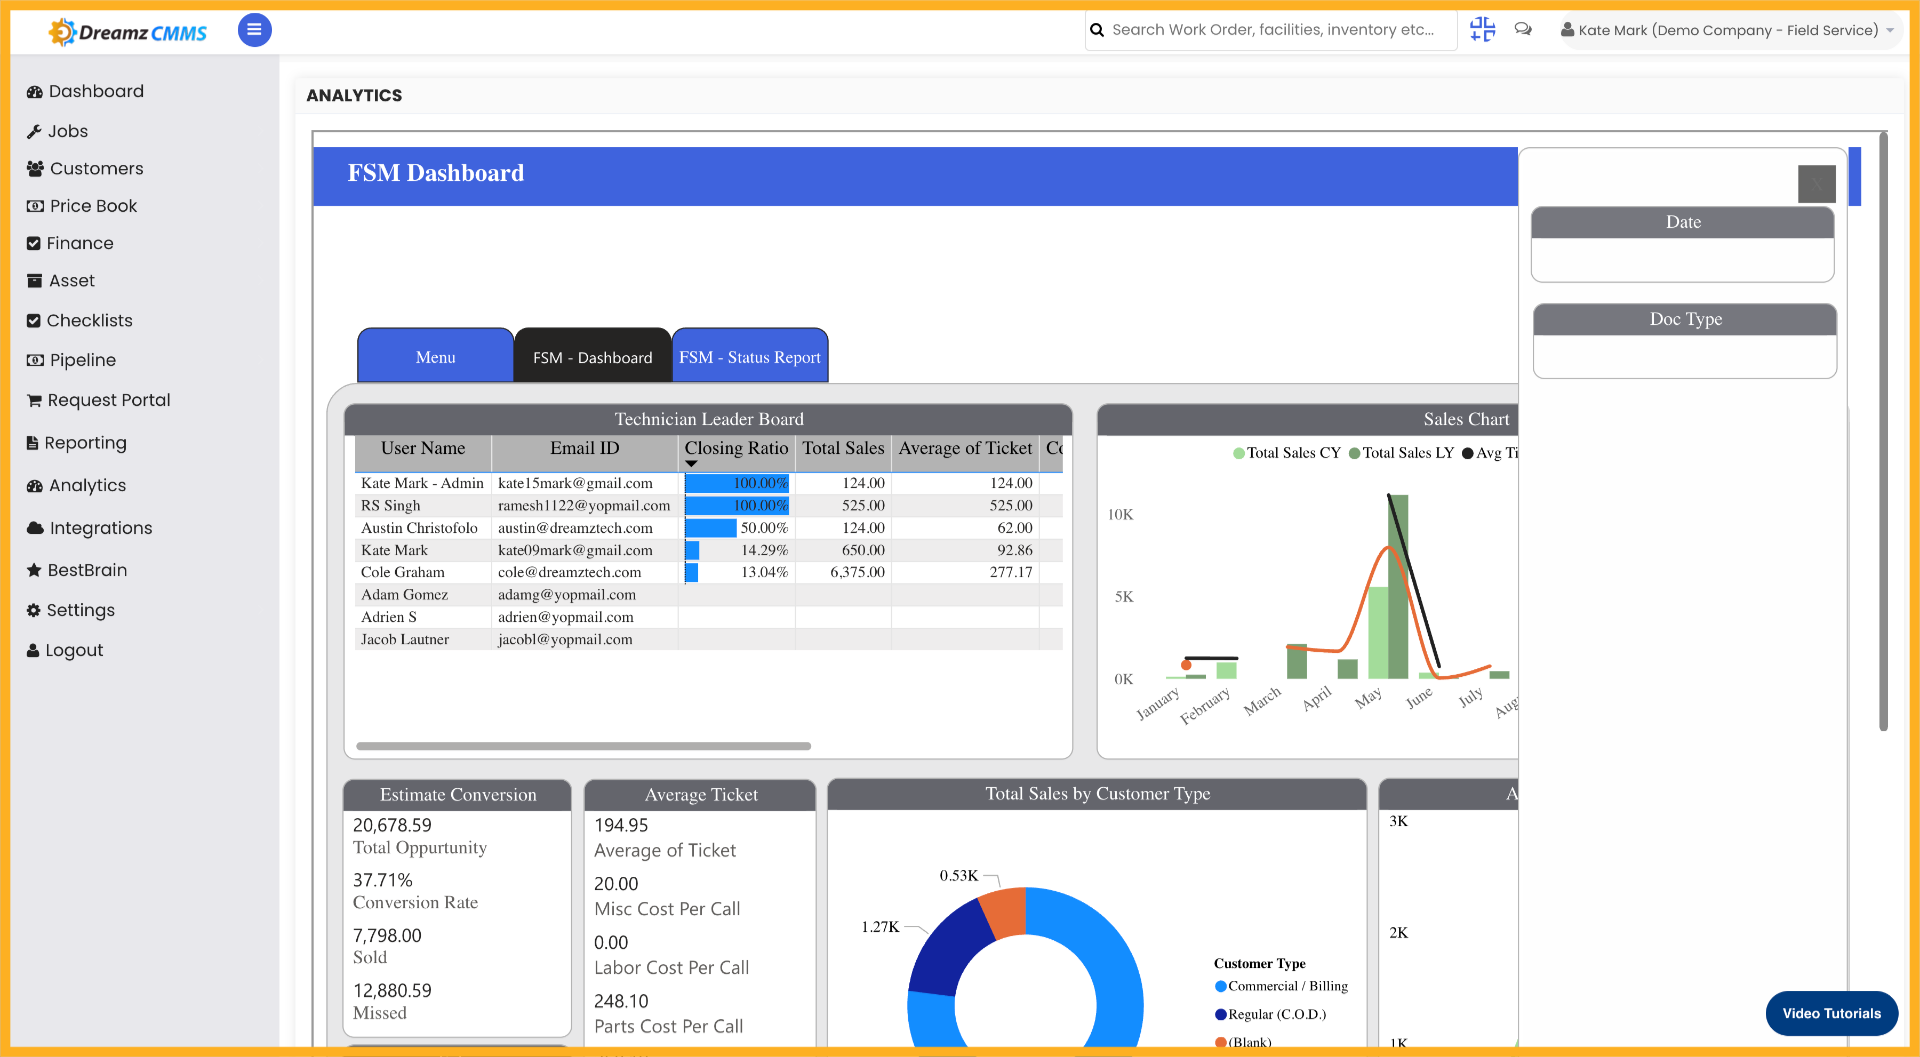
Step 04 – Select Filter Category
Click the filter category to narrow down the data scope for analysis.
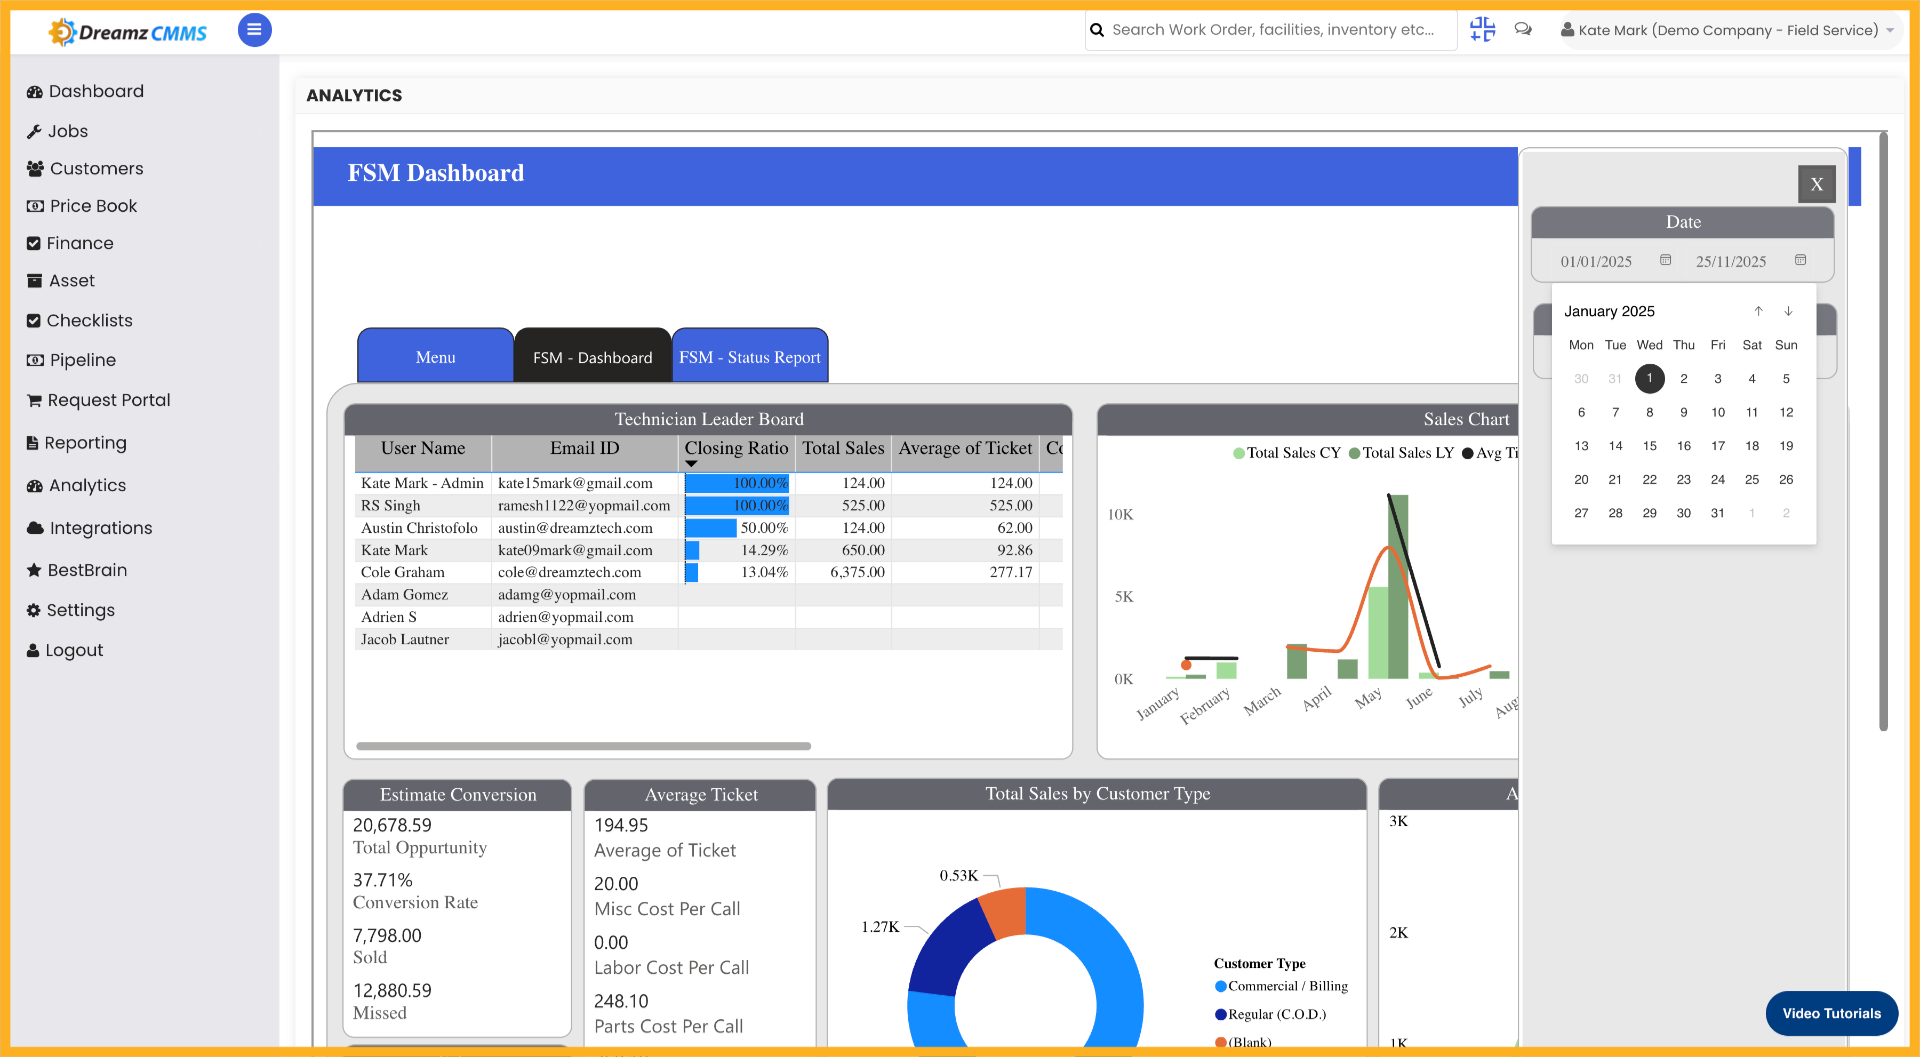
Step 05 – Open Filter Settings
Click the filter settings to customise how data is displayed in your report.
![]()
Step 06 – Expand Filter Menu
Click to expand the date filter menu to select a date range for the analytics data.
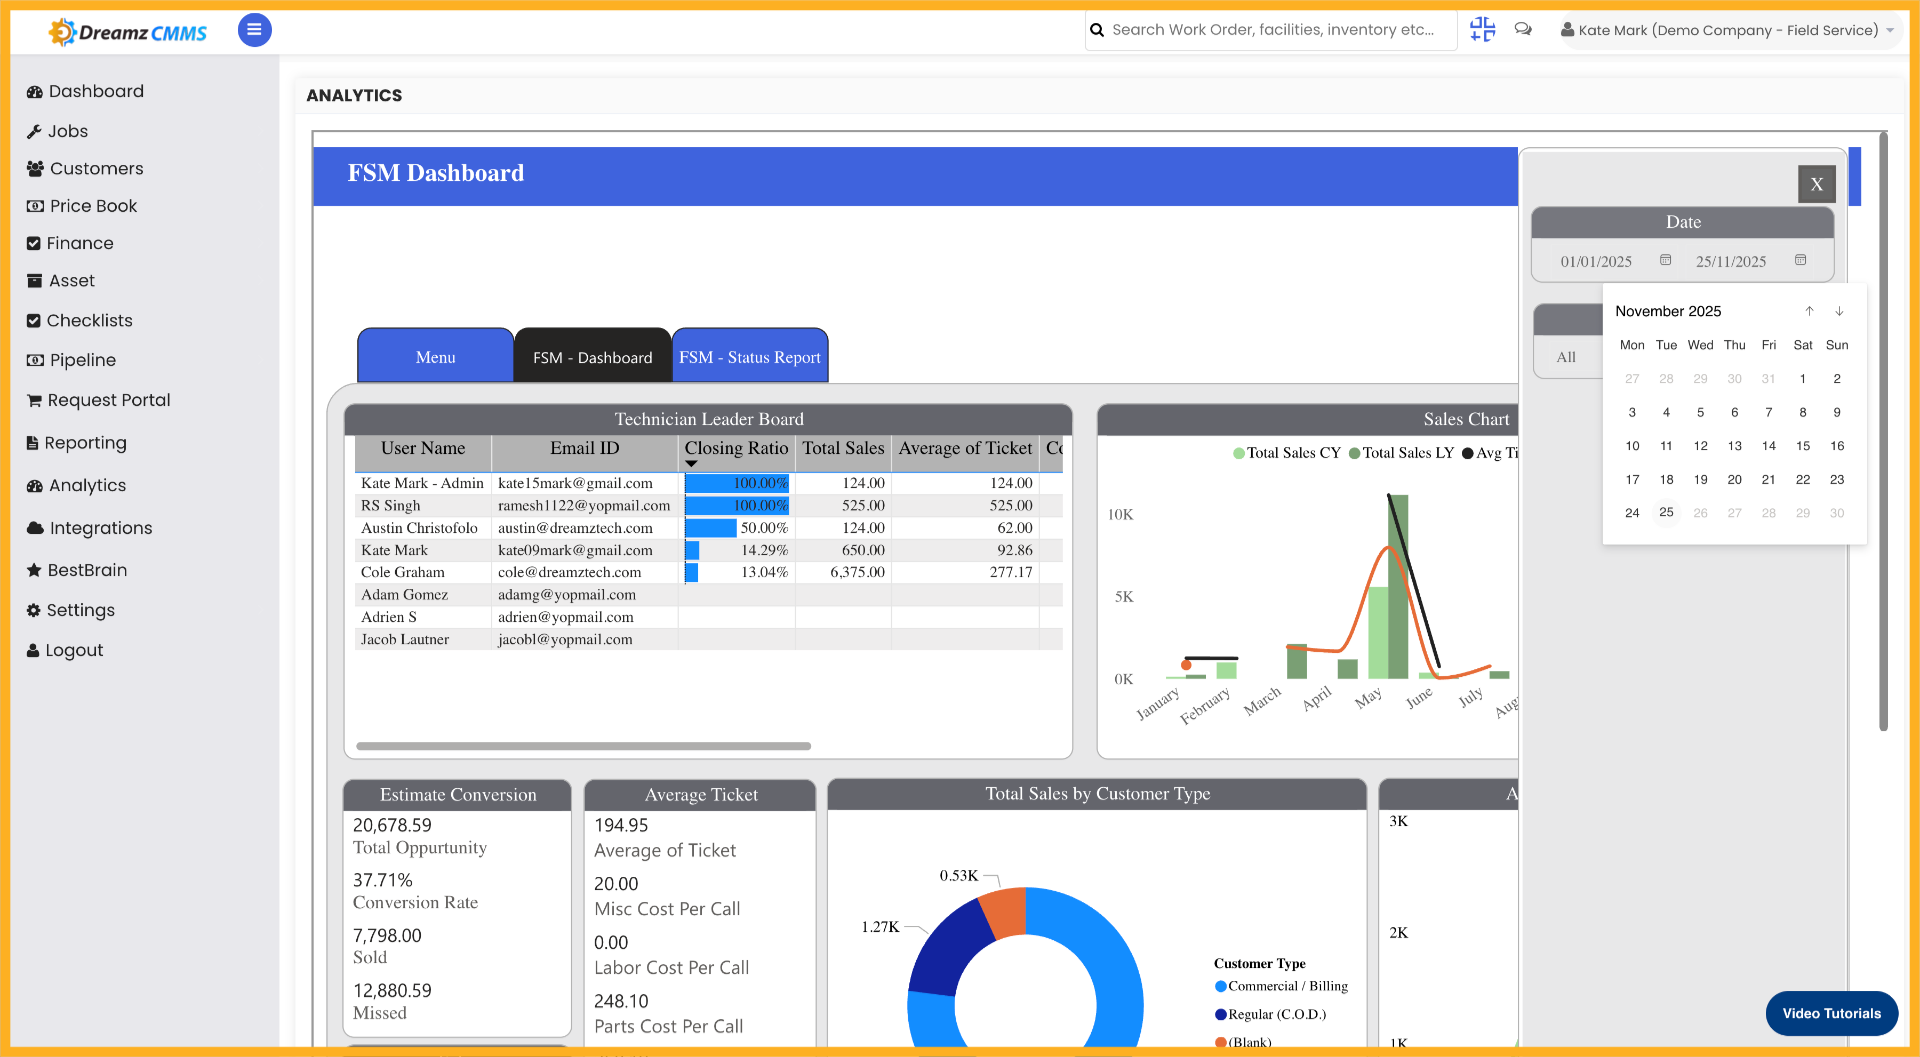
Step 07 – Activate Filter Controls
Click to activate the filter controls for applying specific data conditions.

Step 08 – Select All Filter Values
Click “All” to include all available values in the filter selection.

Step 09 – Choose Document Type Filter
Click “Doc Type” to filter data based on document categories.
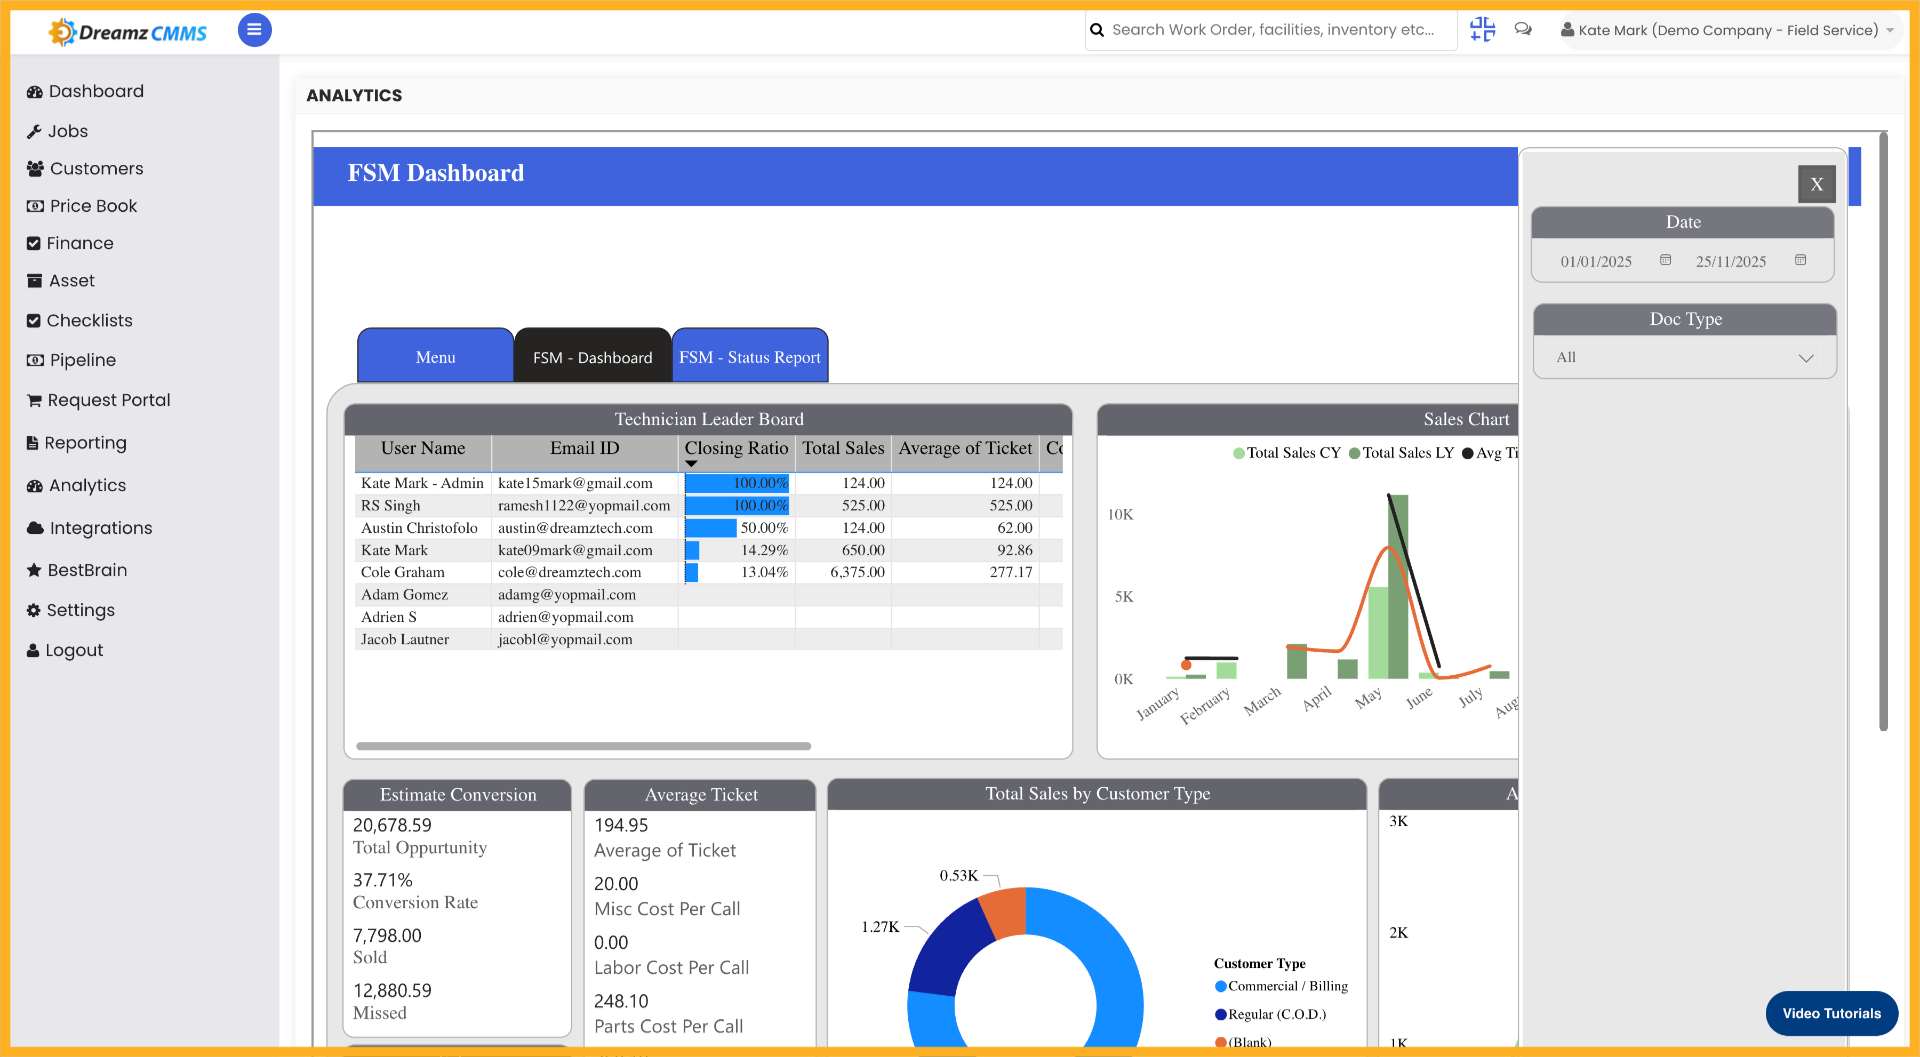
Step 10 – Open User Filter
Click to open the user filter for selecting specific user-related data.
Step 11 – Select User Email Filter
Select the user email filter to focus on data associated with a particular user.
Step 12 – Confirm User Email Selection
Select the user email filter again to confirm the chosen user for data filtering.

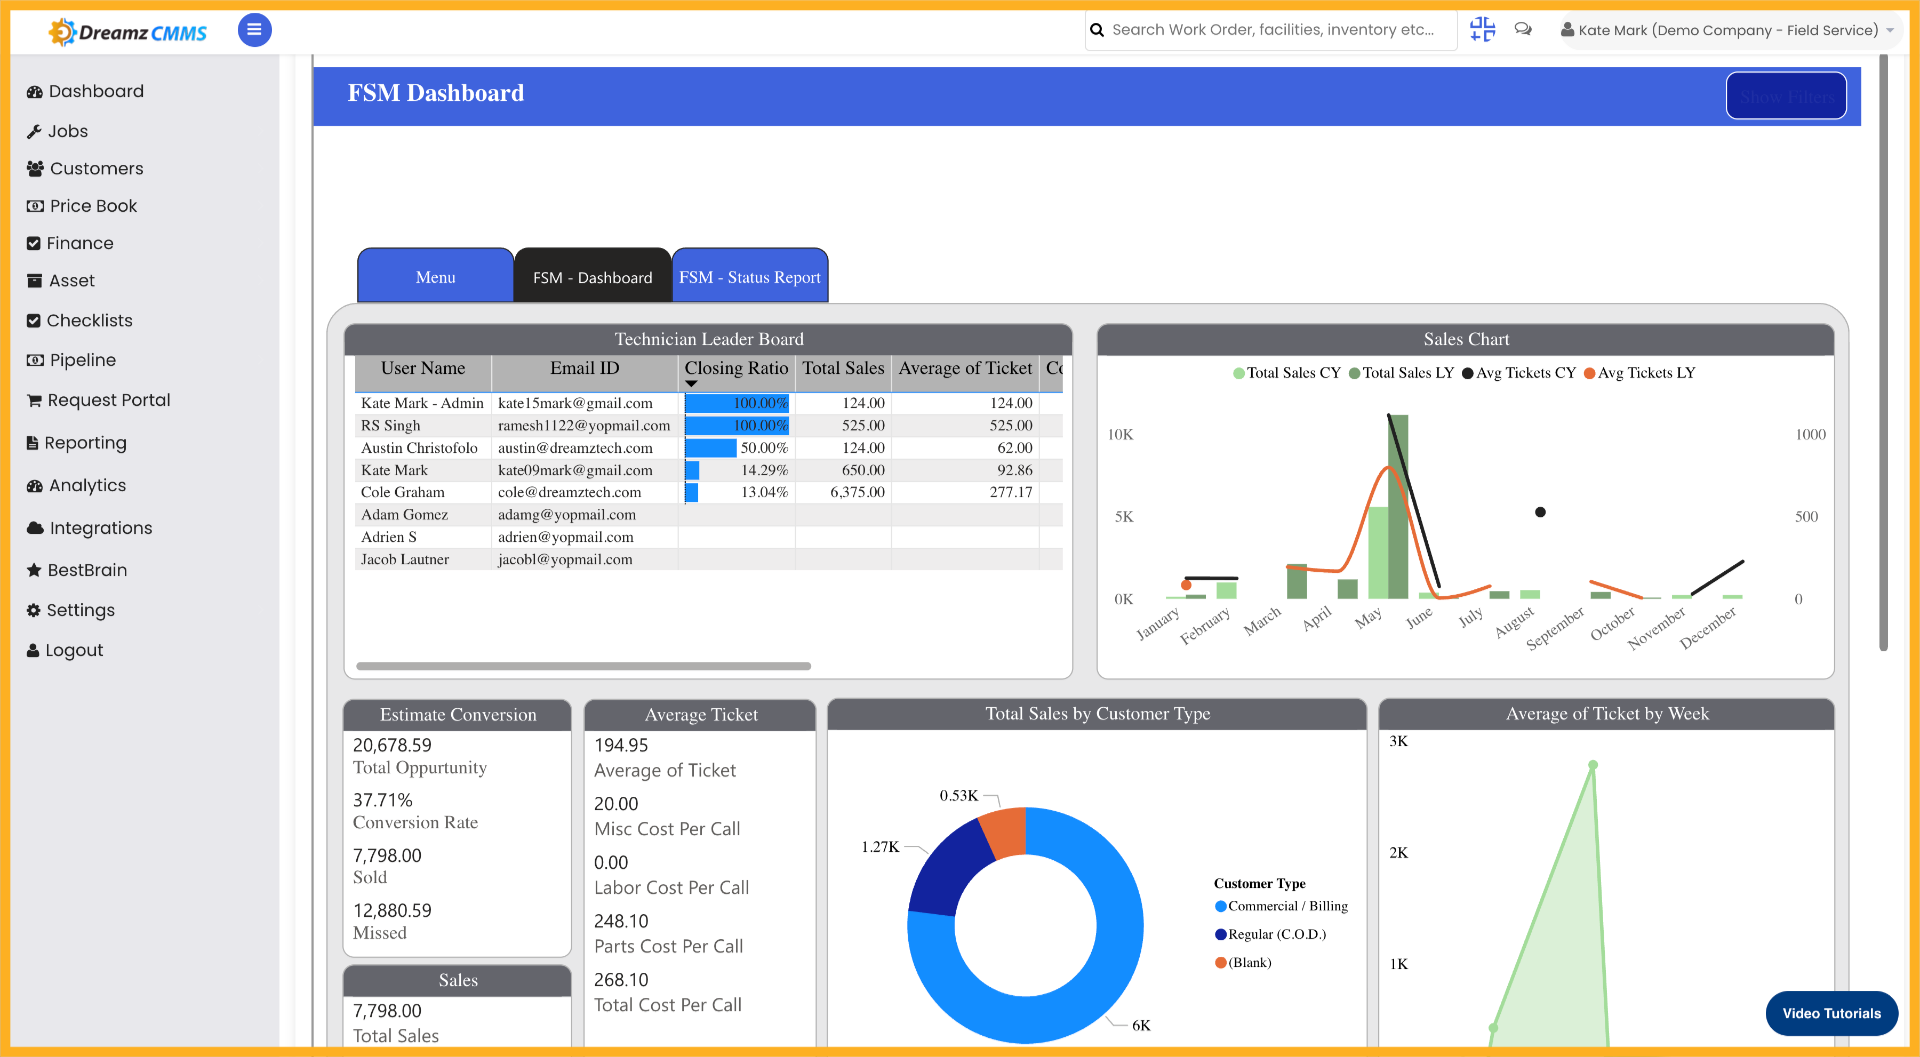
Step 13 – Click on FSM Status Report
Click on FSM Status Report to view the full analytics data with a breakdown of job statuses.
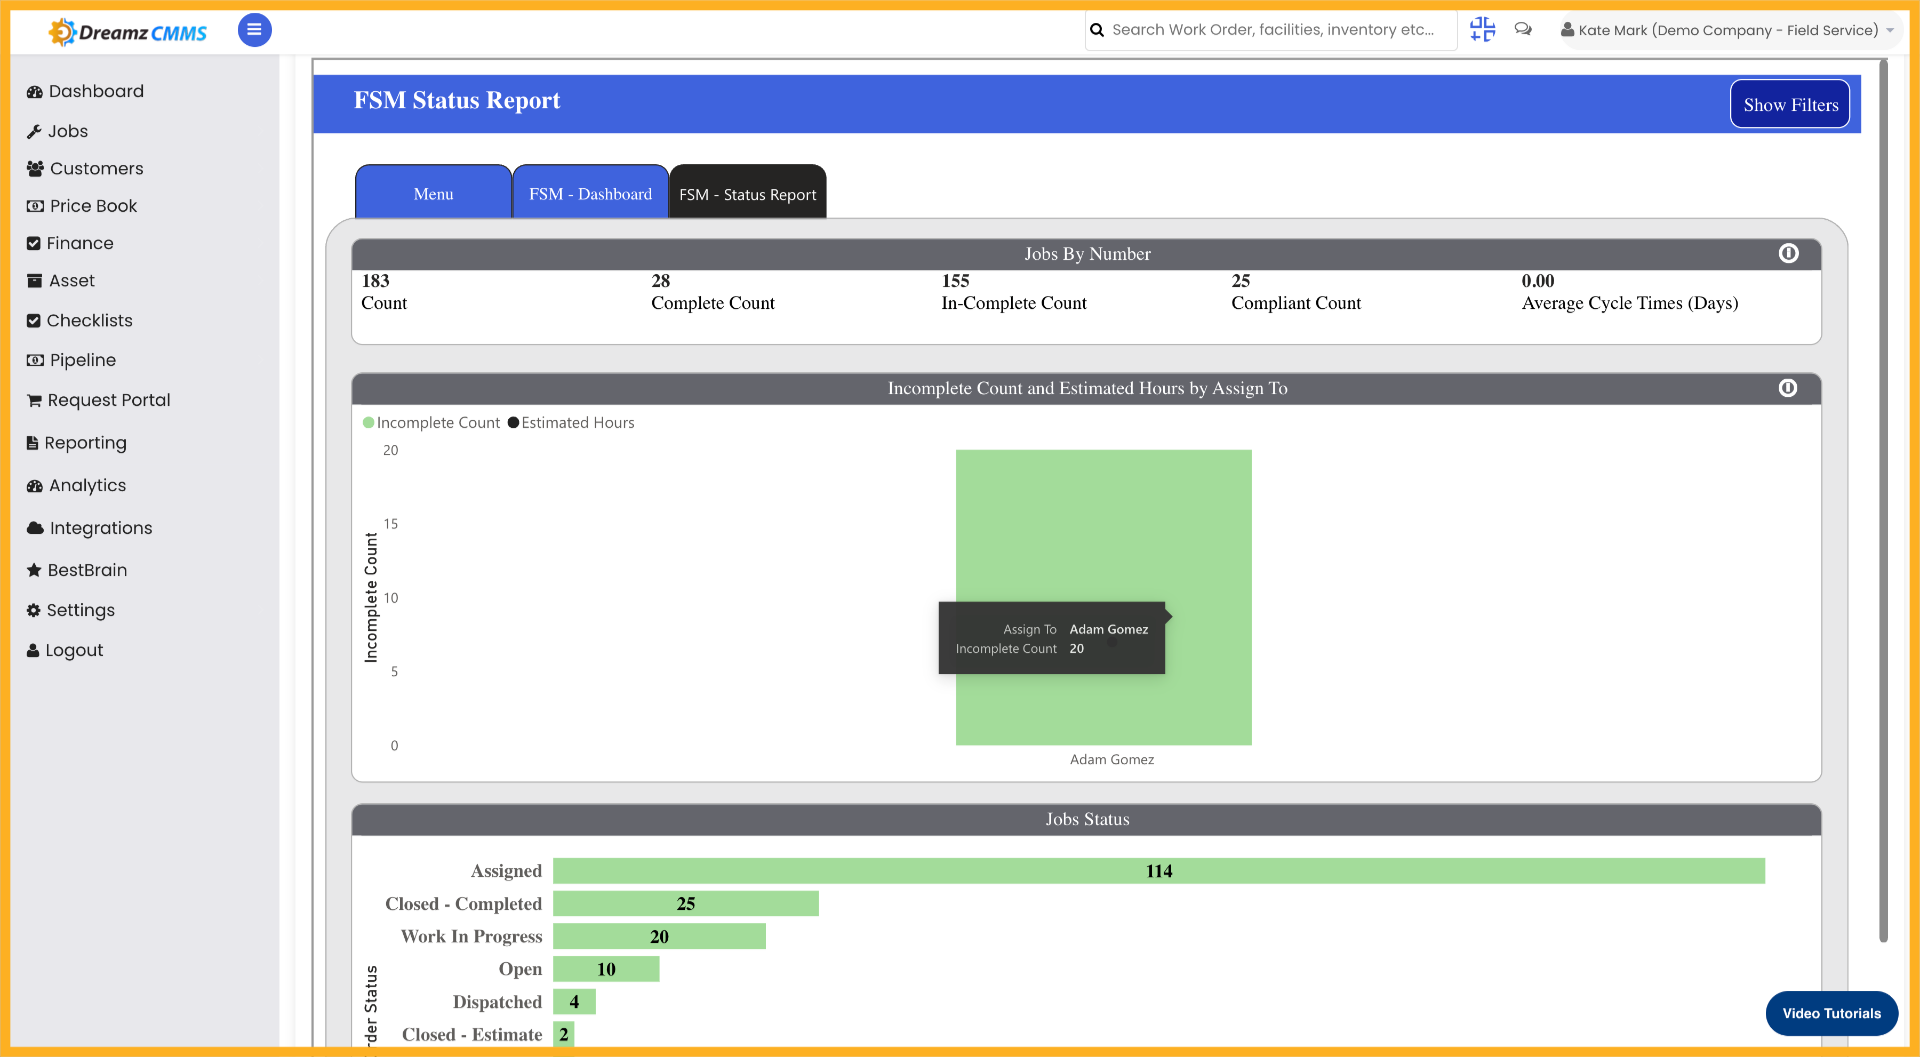
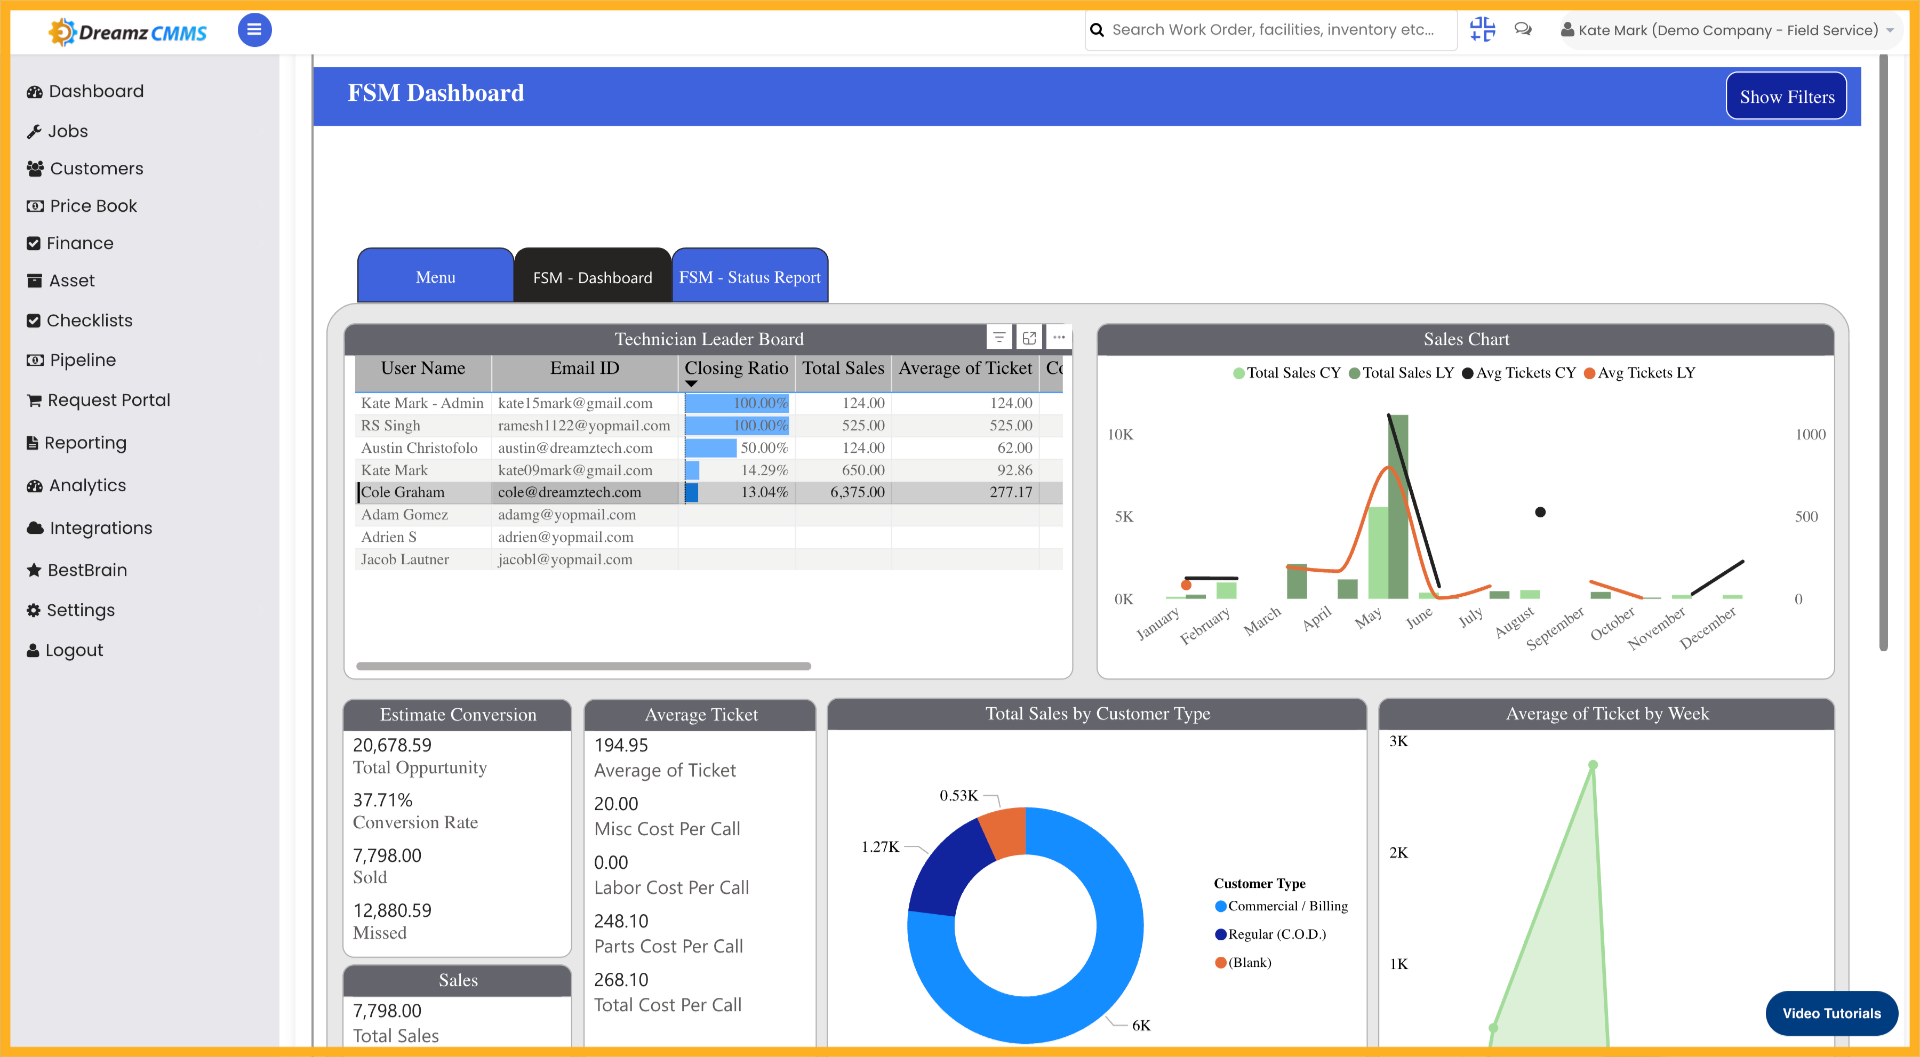
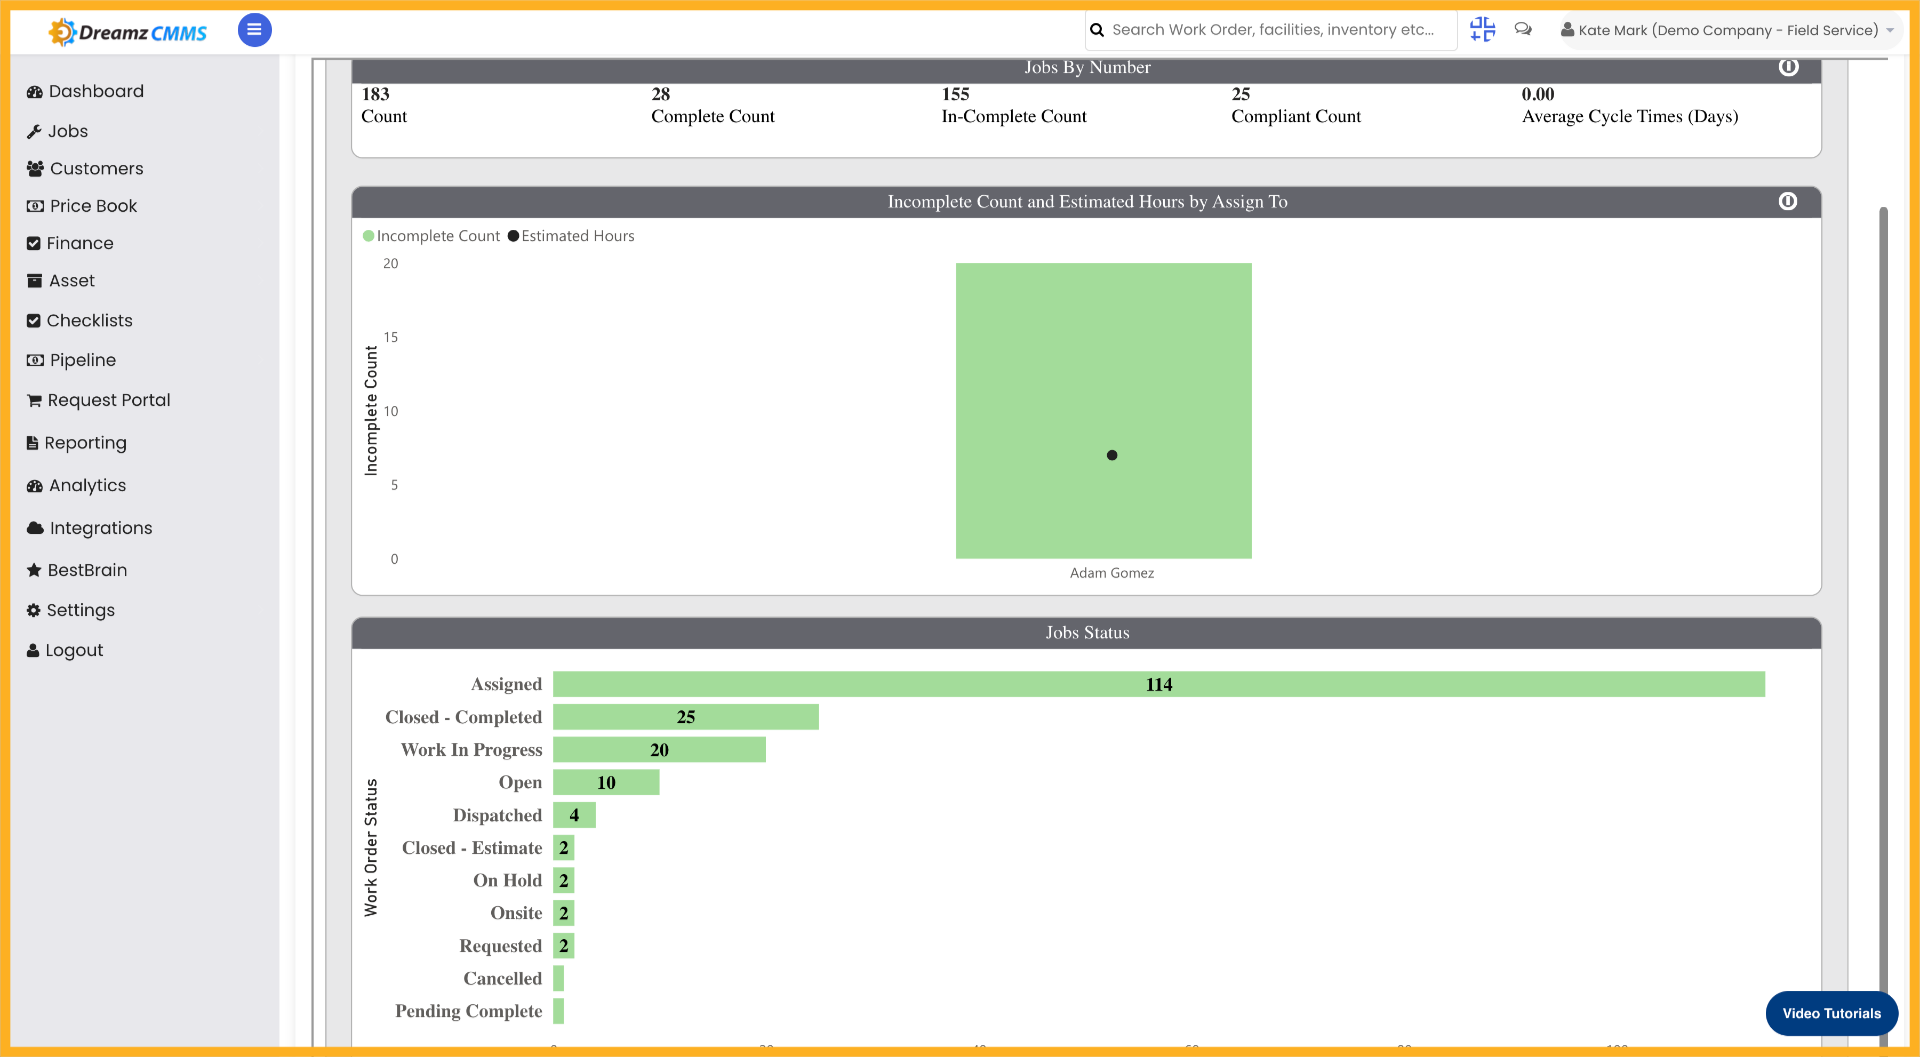
Step 14 – Click on Any Particular Data
Click on any particular data point to drill down and see the detailed data for that particular status.
Tips for Using FSM Analytics Reports
- Use the date filter to narrow your analytics data to a specific time period, making it easier to identify trends or performance changes over a particular range.
- Apply the Doc Type filter to focus on specific document categories such as work orders or invoices, so your report only shows the data most relevant to your analysis.
- Use the user email filter to isolate data for a specific technician or team member, which is useful for individual performance reviews or audits.
- Click on any data point in the FSM Status Report to drill down into more granular details for that particular job status.
- Combine multiple filters together to generate highly specific reports that address your exact reporting or compliance requirements.
Frequently Asked Questions
How do I access the FSM Analytics Report in DreamzCMMS?
Navigate to the Analytics section in DreamzCMMS and click the Analytics panel to open the FSM reporting area where you can configure your data filters and view reports.
Can I filter analytics data by date range?
Yes. Click to expand the date filter menu and select the desired date range to limit the analytics data displayed in your report to a specific time period.
How do I filter the report by a specific user?
Open the user filter, select the user email filter, and confirm the selection. This will filter the analytics data to show only records associated with that particular user.
What is the FSM Status Report?
The FSM Status Report is a visual analytics view that provides a breakdown of job statuses across your field service operations. You can click on any data point in the report to drill down and view more detailed information for that specific status.
Can I apply multiple filters at the same time?
Yes. You can combine filter categories, document type filters, date range filters, and user filters simultaneously to generate highly specific and targeted analytics reports.
Related Articles
- Schedule Jobs and Kanban View
- Plan Routes & Assign Jobs
- How to Create Jobs
- Invoicing from App
- Add Expenses from App