Analytics Report for Request
The Analytics Report for Request in DreamzCMMS gives you insight into all created requests. You will be able to click on different sections and graphs to explore and analyse your request analytics in detail.
Overview
The Request Analytics feature in DreamzCMMS provides a comprehensive view of all created requests through interactive charts and graphs. Users can open the Analytics Requests section, select specific requests from the list, and drill into detailed views to analyse data and take further action. This feature helps managers and teams stay informed on request volumes, statuses, and trends across their operations.
Here is a reference video:
Steps to Access and Use the Request Analytics Report
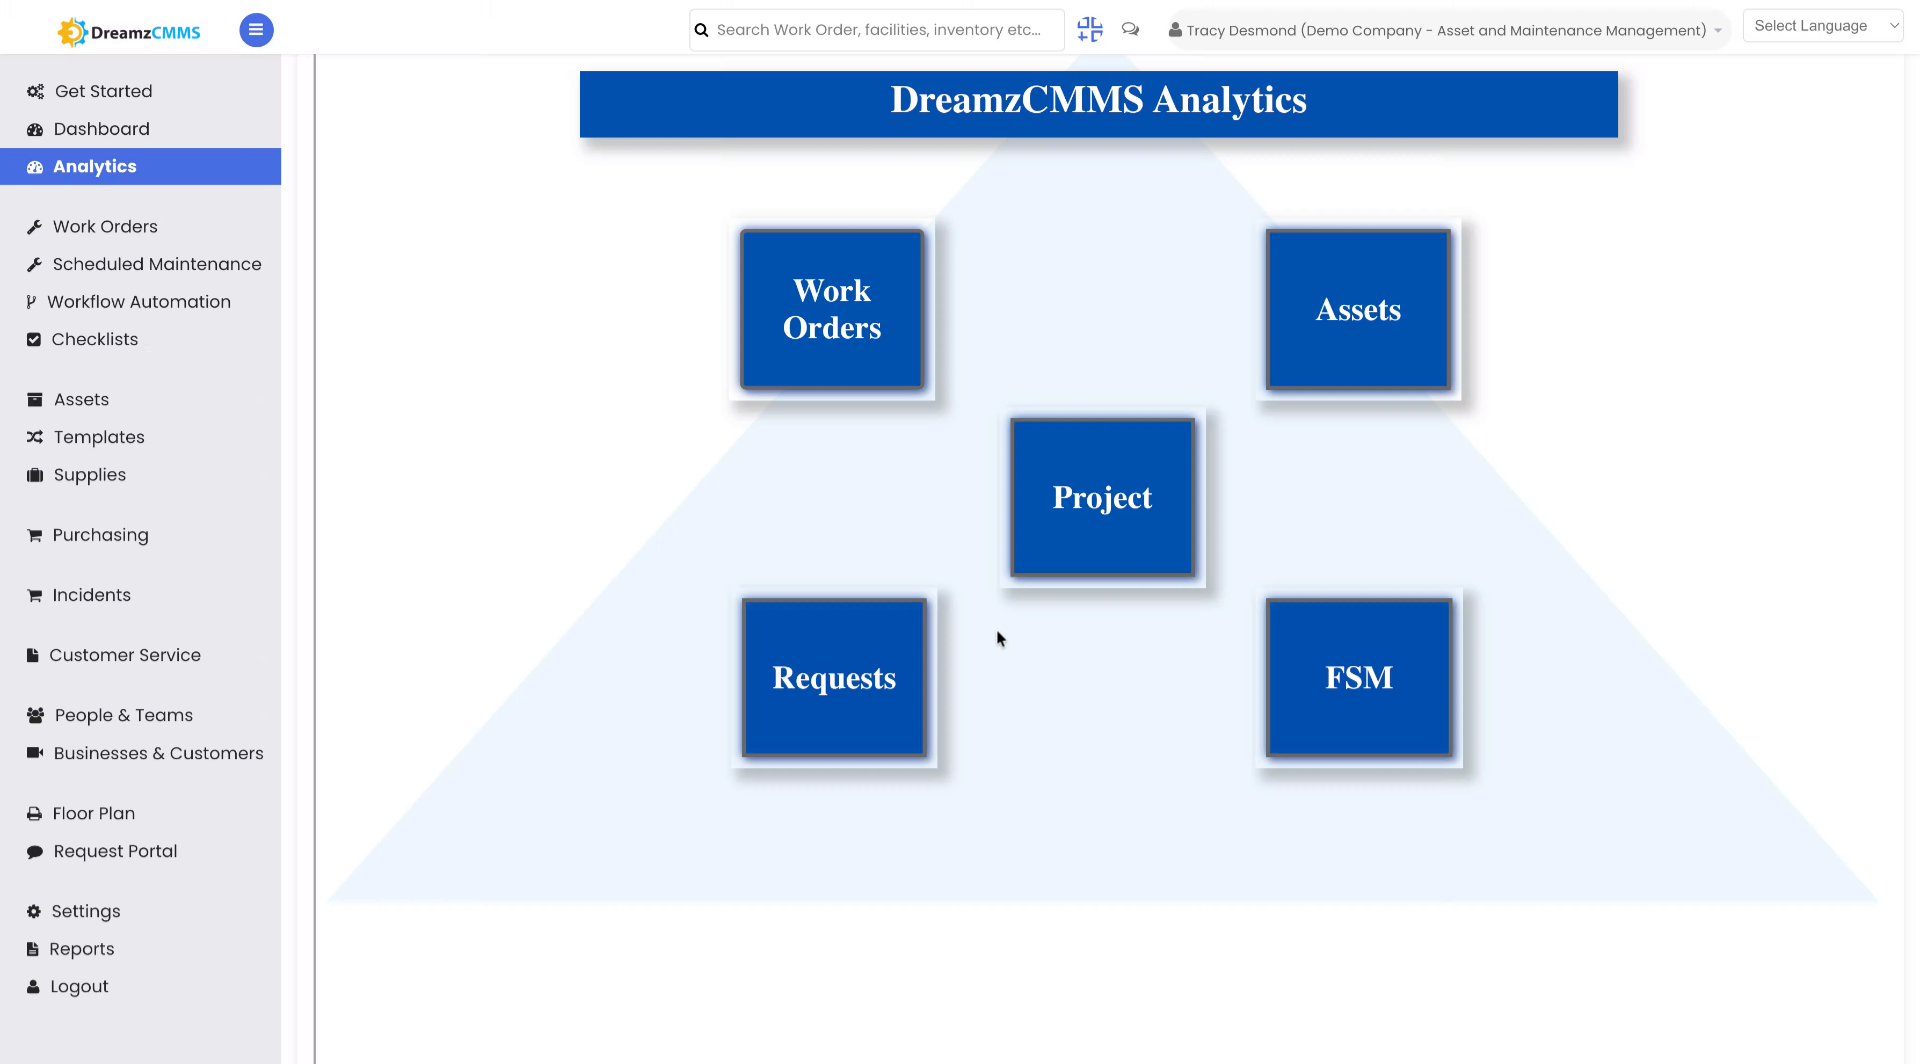
Step 01 – Analytics Report for Request
Analytics gives you insight about created Requests. You will be able to click on different sections and graphs and see your analytics data at a glance.
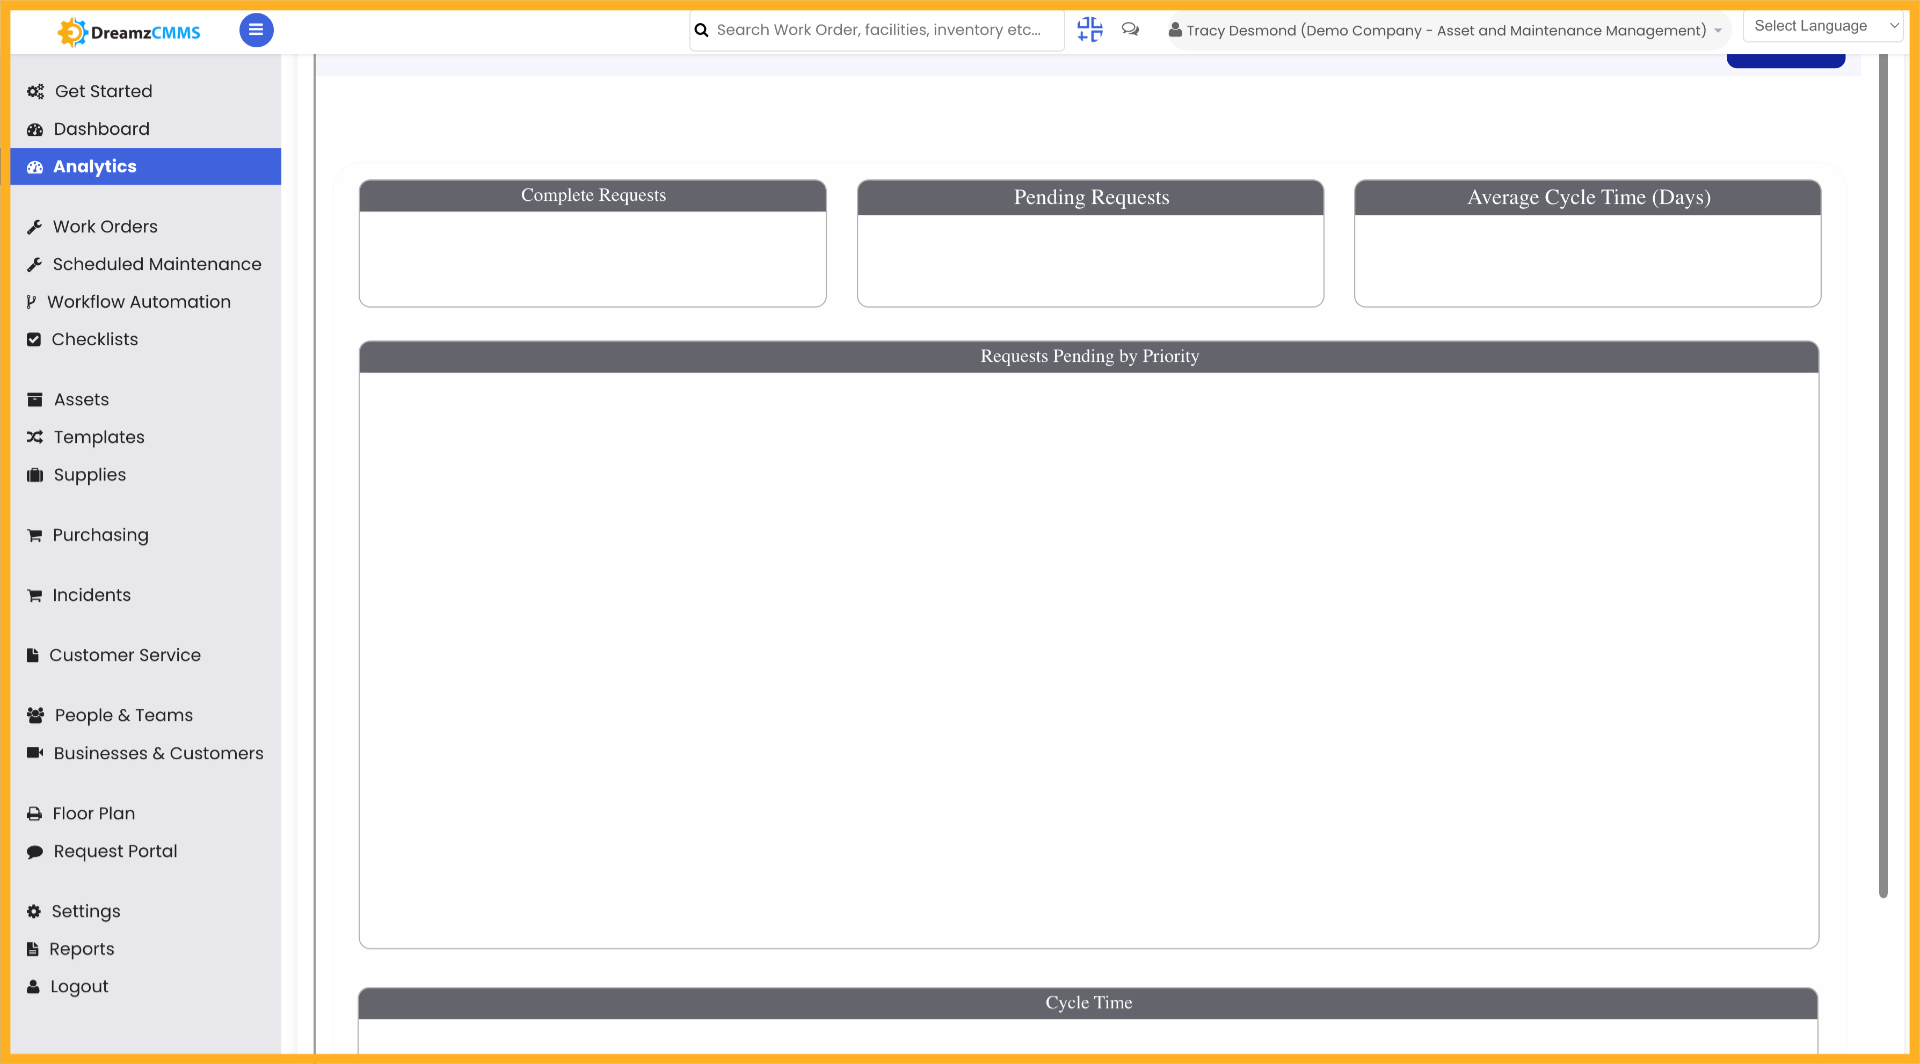
Step 02 – Open Analytics Requests
Click the Request button to open the Analytics Requests section, where you can view and manage your data requests.
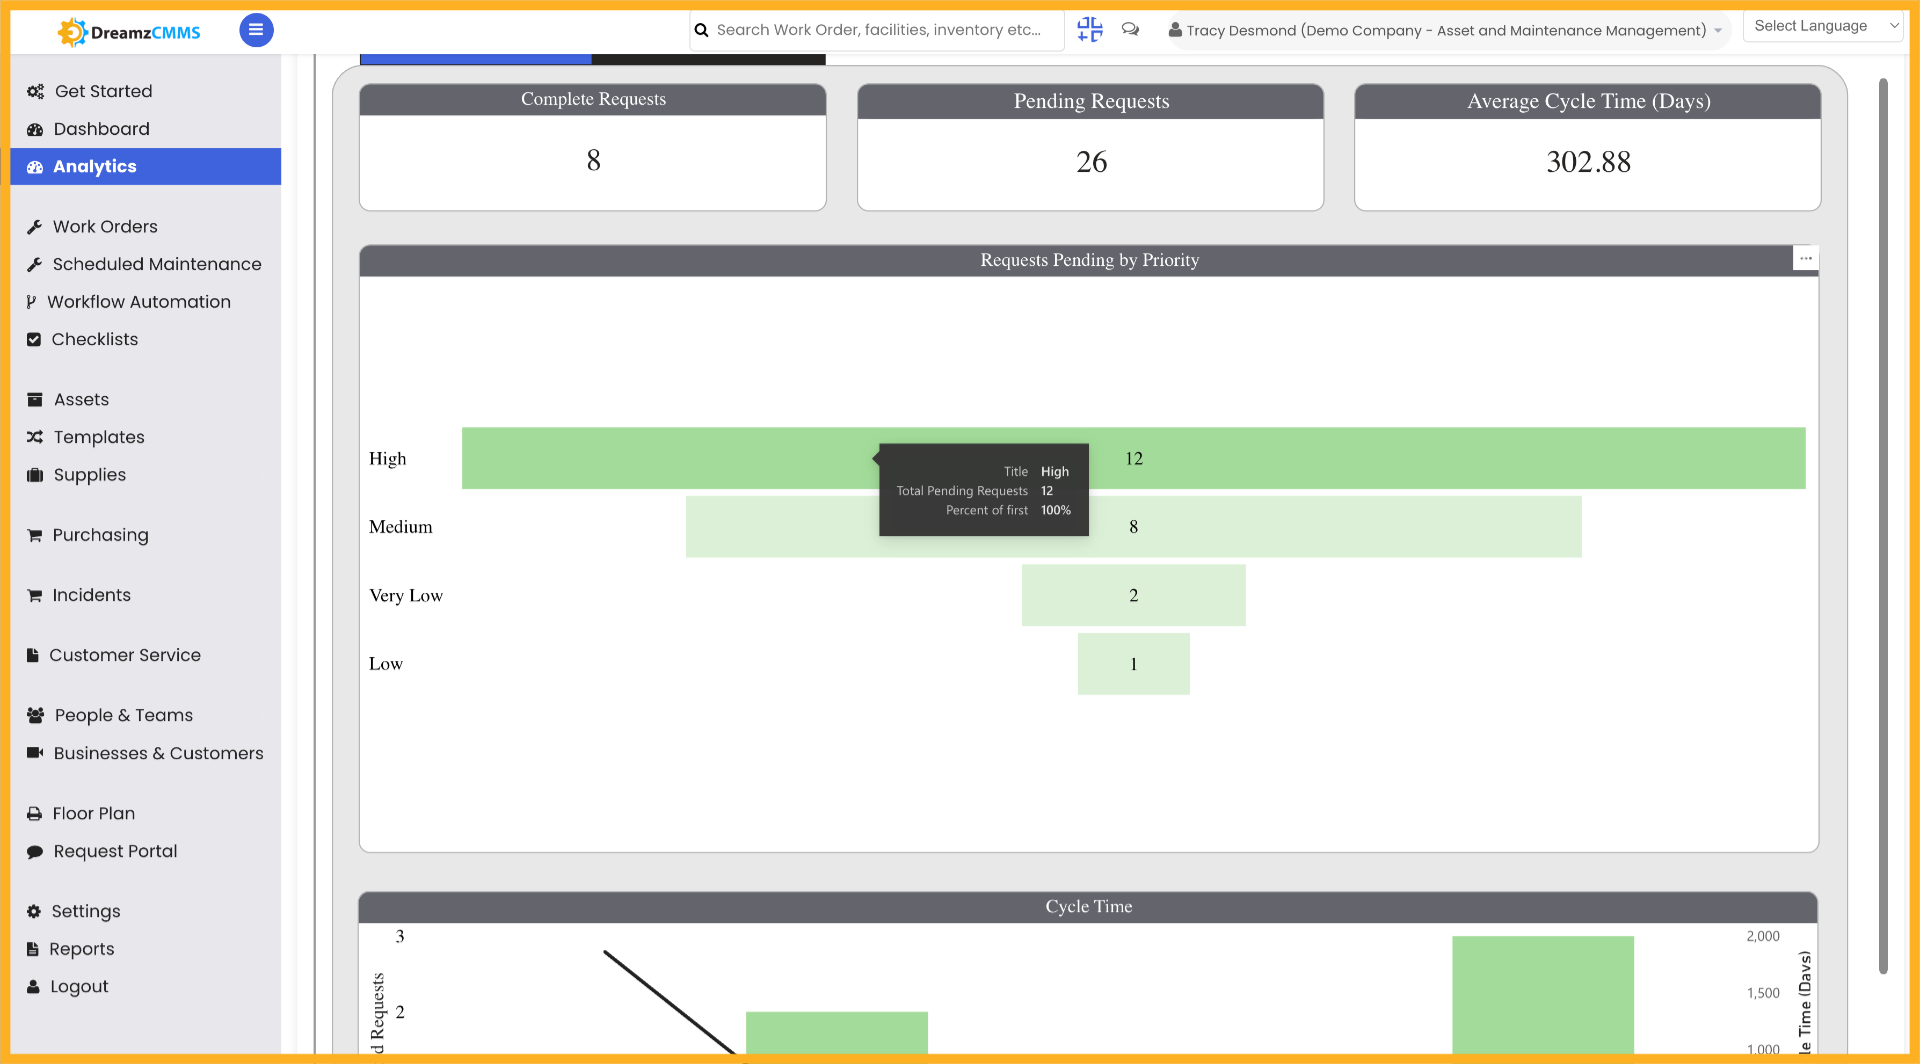
Step 03 – Select Specific Request
Click the desired request from the list to review its details and status within the analytics dashboard.
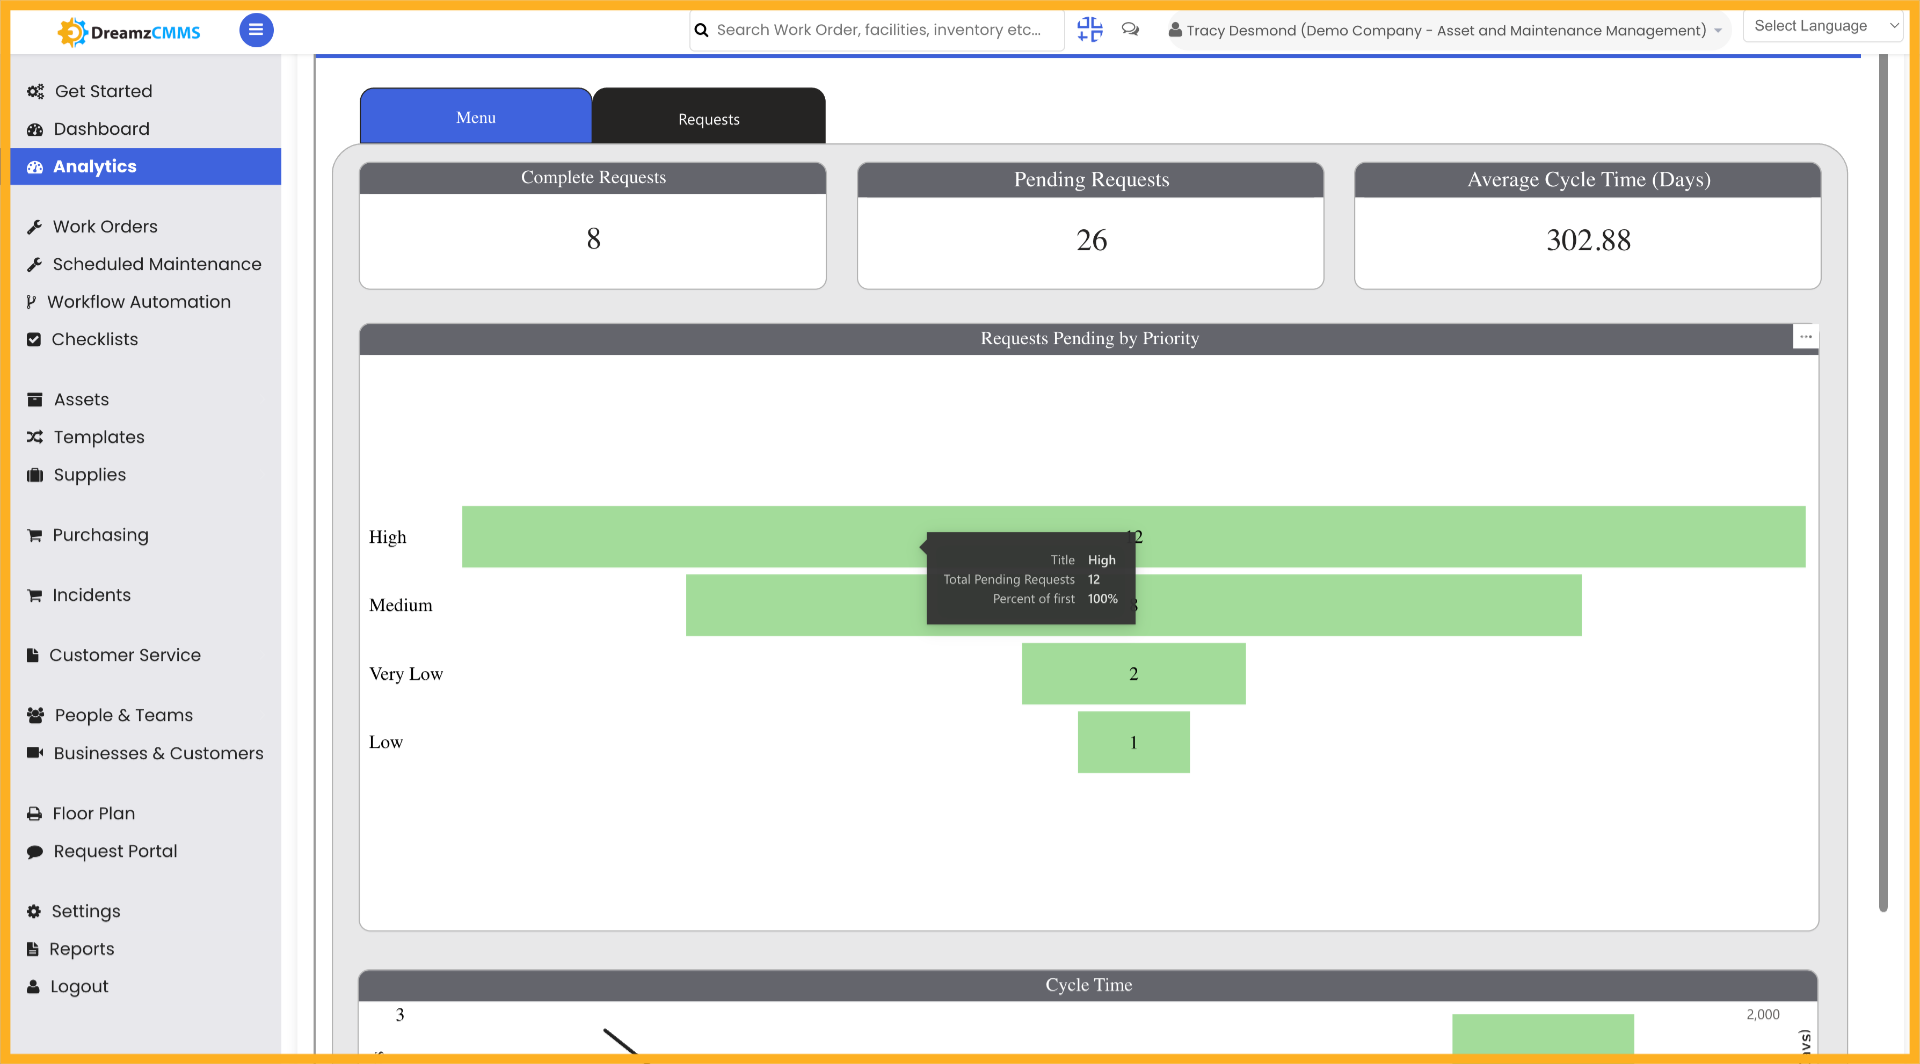
Step 04 – Access Request Details
Click to open the detailed view of the selected request, allowing you to analyse the data and take further action as needed.
Tips for Using the Request Analytics Report
- Click on different sections and graphs within the analytics dashboard to interactively explore your request data and uncover trends.
- Use the Request button in the Analytics panel to quickly navigate directly to the Request analytics section without having to browse through other report types.
- Select a specific request from the list to drill into its details, making it easier to review the status and history of individual requests.
- Use the detailed view of a request to gather precise data before taking further action, such as escalating, reassigning, or closing a request.
- Review the analytics regularly to monitor request volumes and statuses across your team and identify any bottlenecks or areas that require attention.
Frequently Asked Questions
How do I access the Analytics Report for Requests in DreamzCMMS?
Navigate to the Analytics section in DreamzCMMS and click the Request button to open the Analytics Requests section, where you can view and interact with all request-related data.
Can I interact with the graphs and charts in the analytics dashboard?
Yes. You can click on different sections and graphs within the Analytics Report to explore your request data interactively and see a breakdown of the information for each category.
How do I view the details of a specific request from the analytics list?
Click the desired request from the list in the Analytics Requests section to open its detailed view. From there, you can review its status, data, and take any further required action.
What information is available in the detailed view of a request?
The detailed view of a selected request provides a comprehensive look at the request's data and current status, allowing you to analyse the information and take appropriate follow-up actions.
Is the Request Analytics Report available to all users?
Access to the Analytics section may depend on your user role and permissions within DreamzCMMS. Please check with your system administrator if you do not see the Analytics option in your menu.
Related Articles
- Analytics Report for FSM
- Schedule Jobs and Kanban View
- Plan Routes & Assign Jobs
- How to Create Jobs
- Invoicing from App