Analytics Reports for Assets
The Analytics Reports for Assets in DreamzCMMS provides detailed insights into your asset performance and reliability. This guide walks you through how to access, configure, and filter your asset analytics data to generate meaningful reports and drill down into specific assets.
Overview
The Asset Analytics section in DreamzCMMS allows users to view and analyse asset-related data through a variety of filters and visualisations. From the Analytics section, users can navigate to asset reliability data, apply date filters, select specific assets for detailed analysis, and customise how data is displayed using the visualisation settings. This feature helps teams monitor asset health, track performance trends, and make informed maintenance decisions.
Here is a reference video:
Steps to Access and Configure the Asset Analytics Report
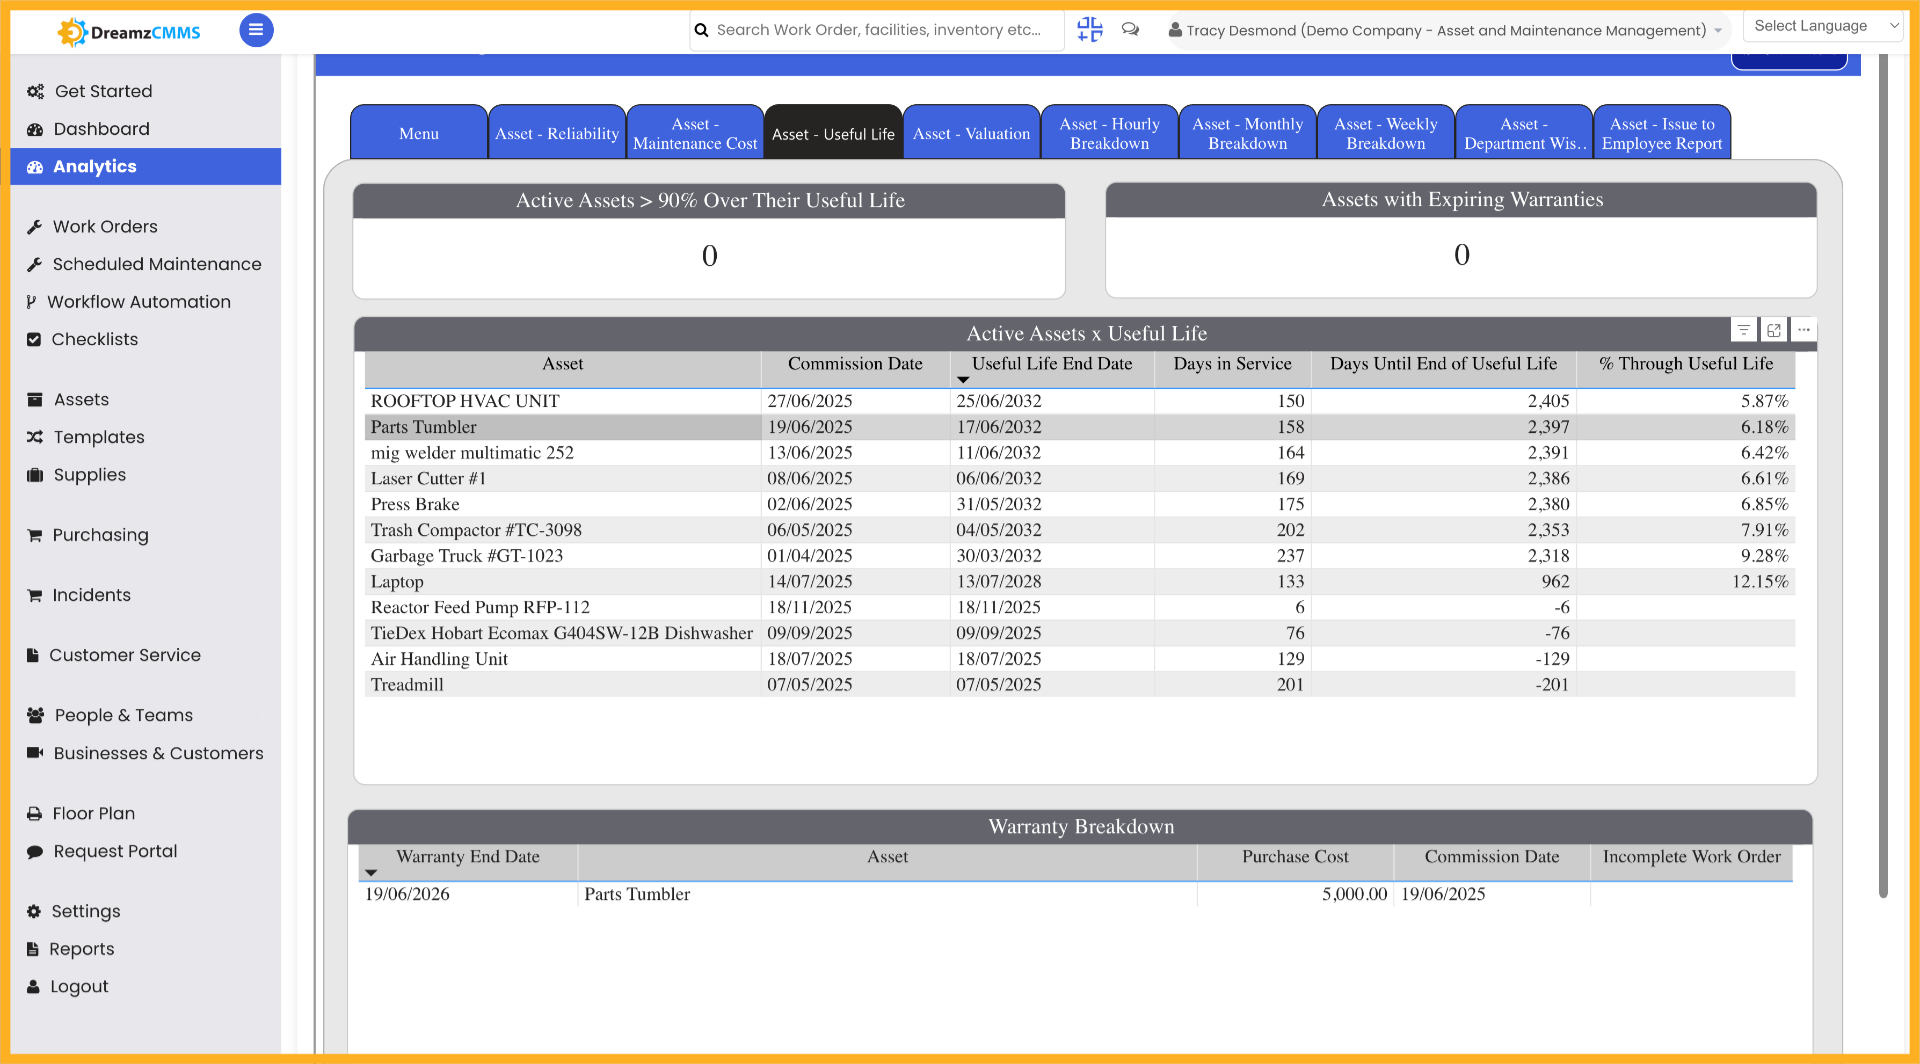
Step 01 – Analytics Reports for Assets
This analytics data guides you through the assets report. Navigate to the Analytics section within DreamzCMMS to get started.
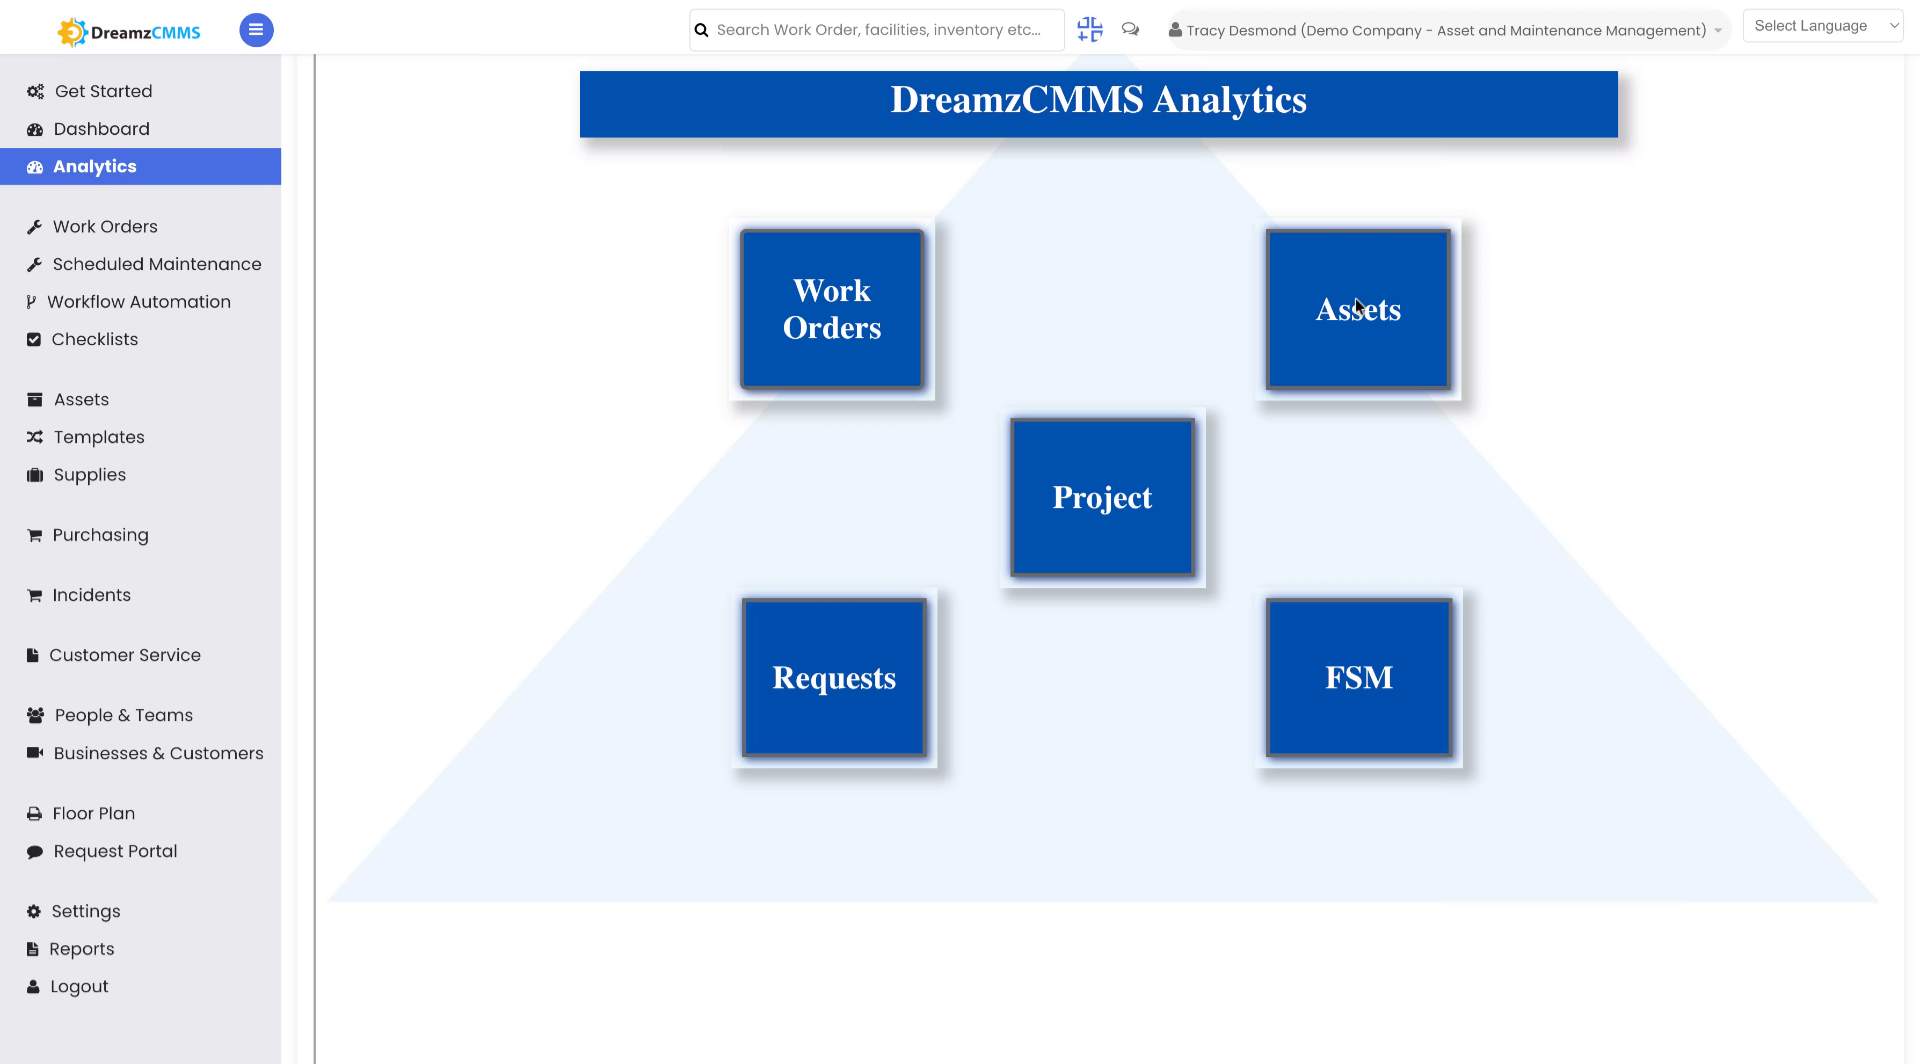
Step 02 – Open Analytics Section
Click the Analytics section to begin configuring your assets.
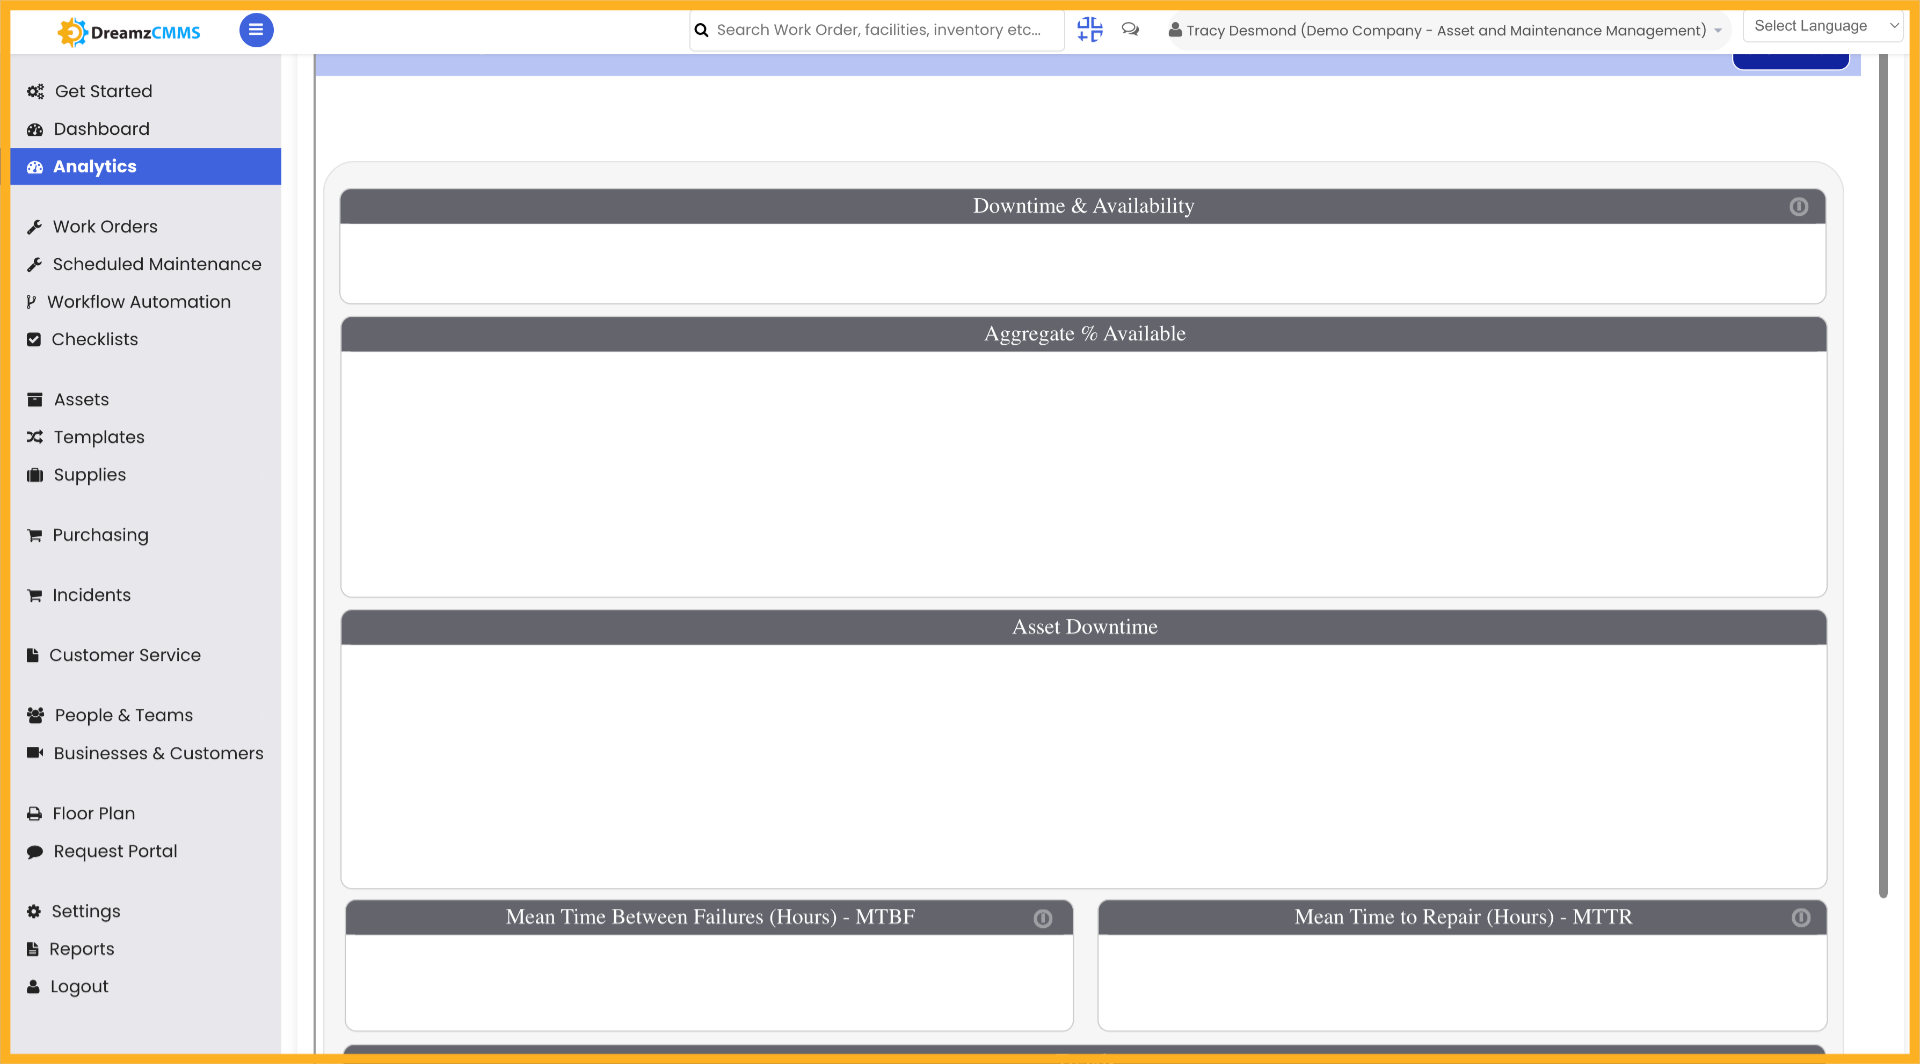
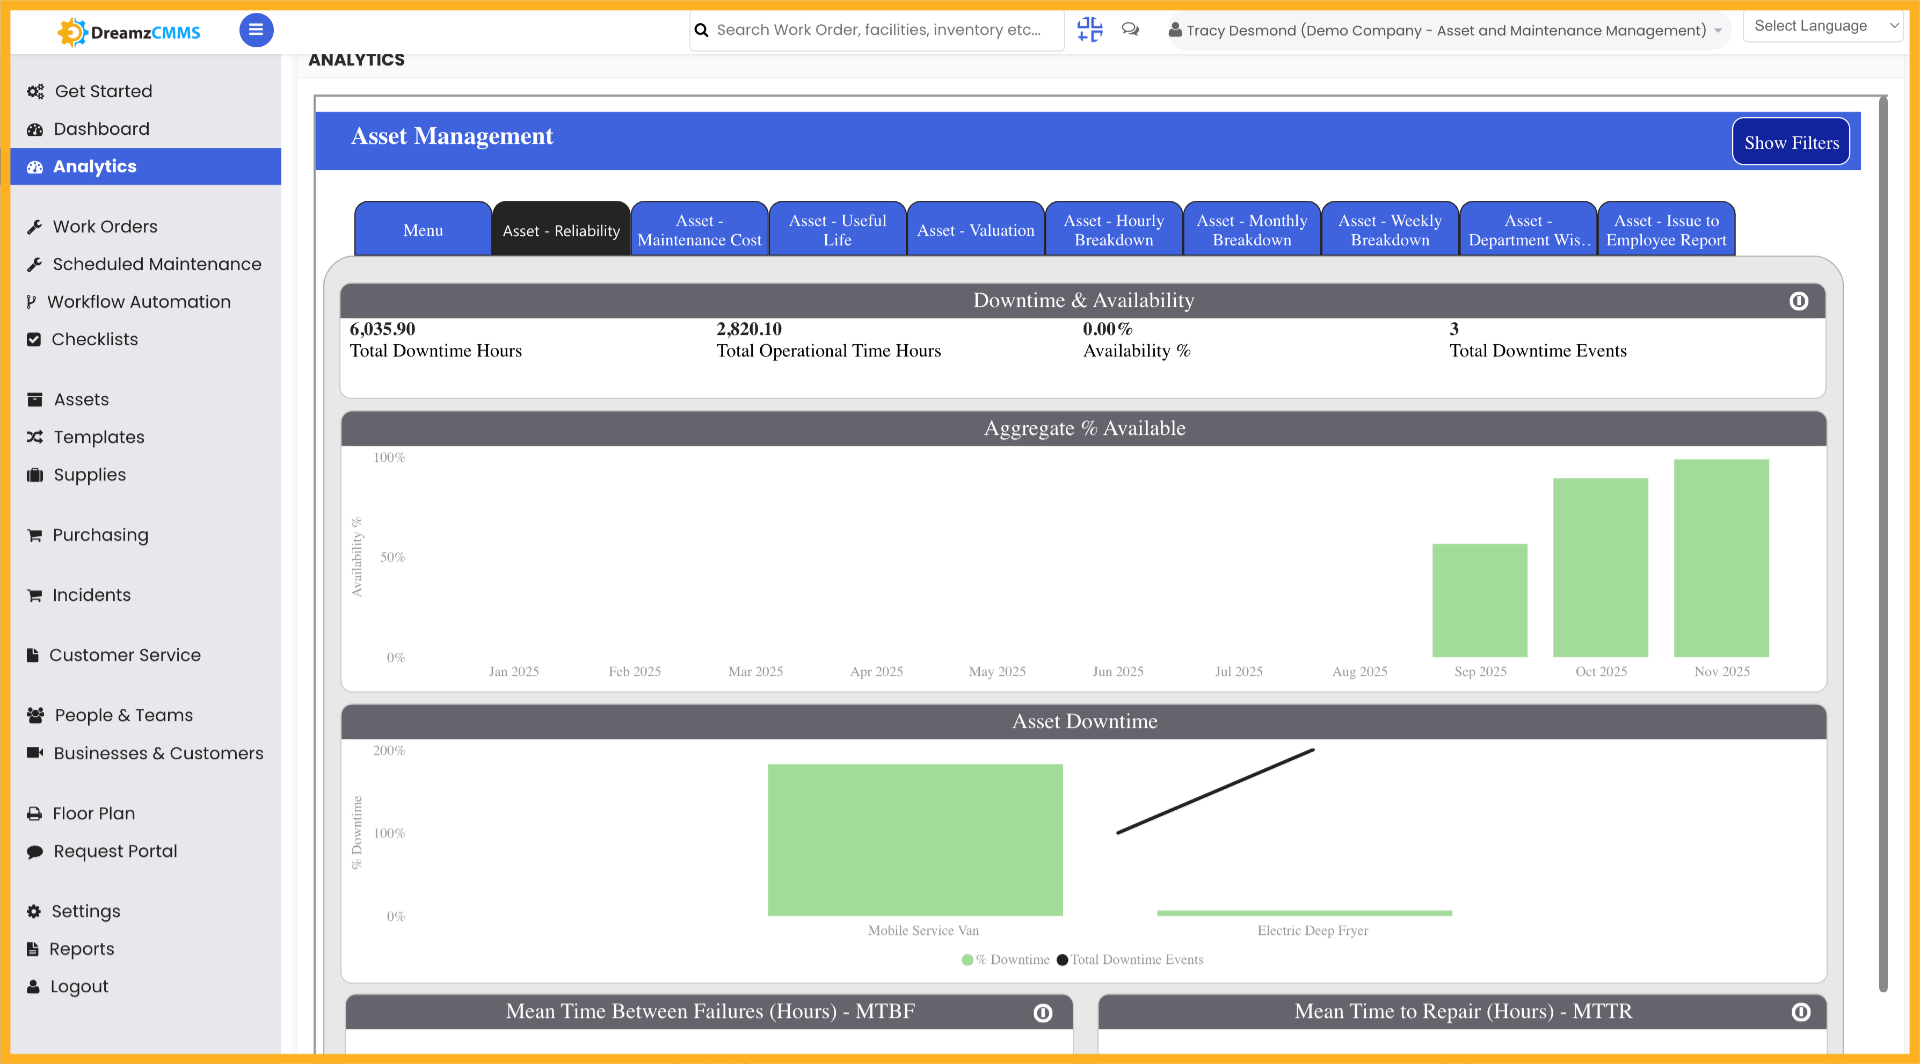
Step 03 – Open Asset Reliability Analytics
Click on Asset Reliability to view asset-related data based on reliability metrics.
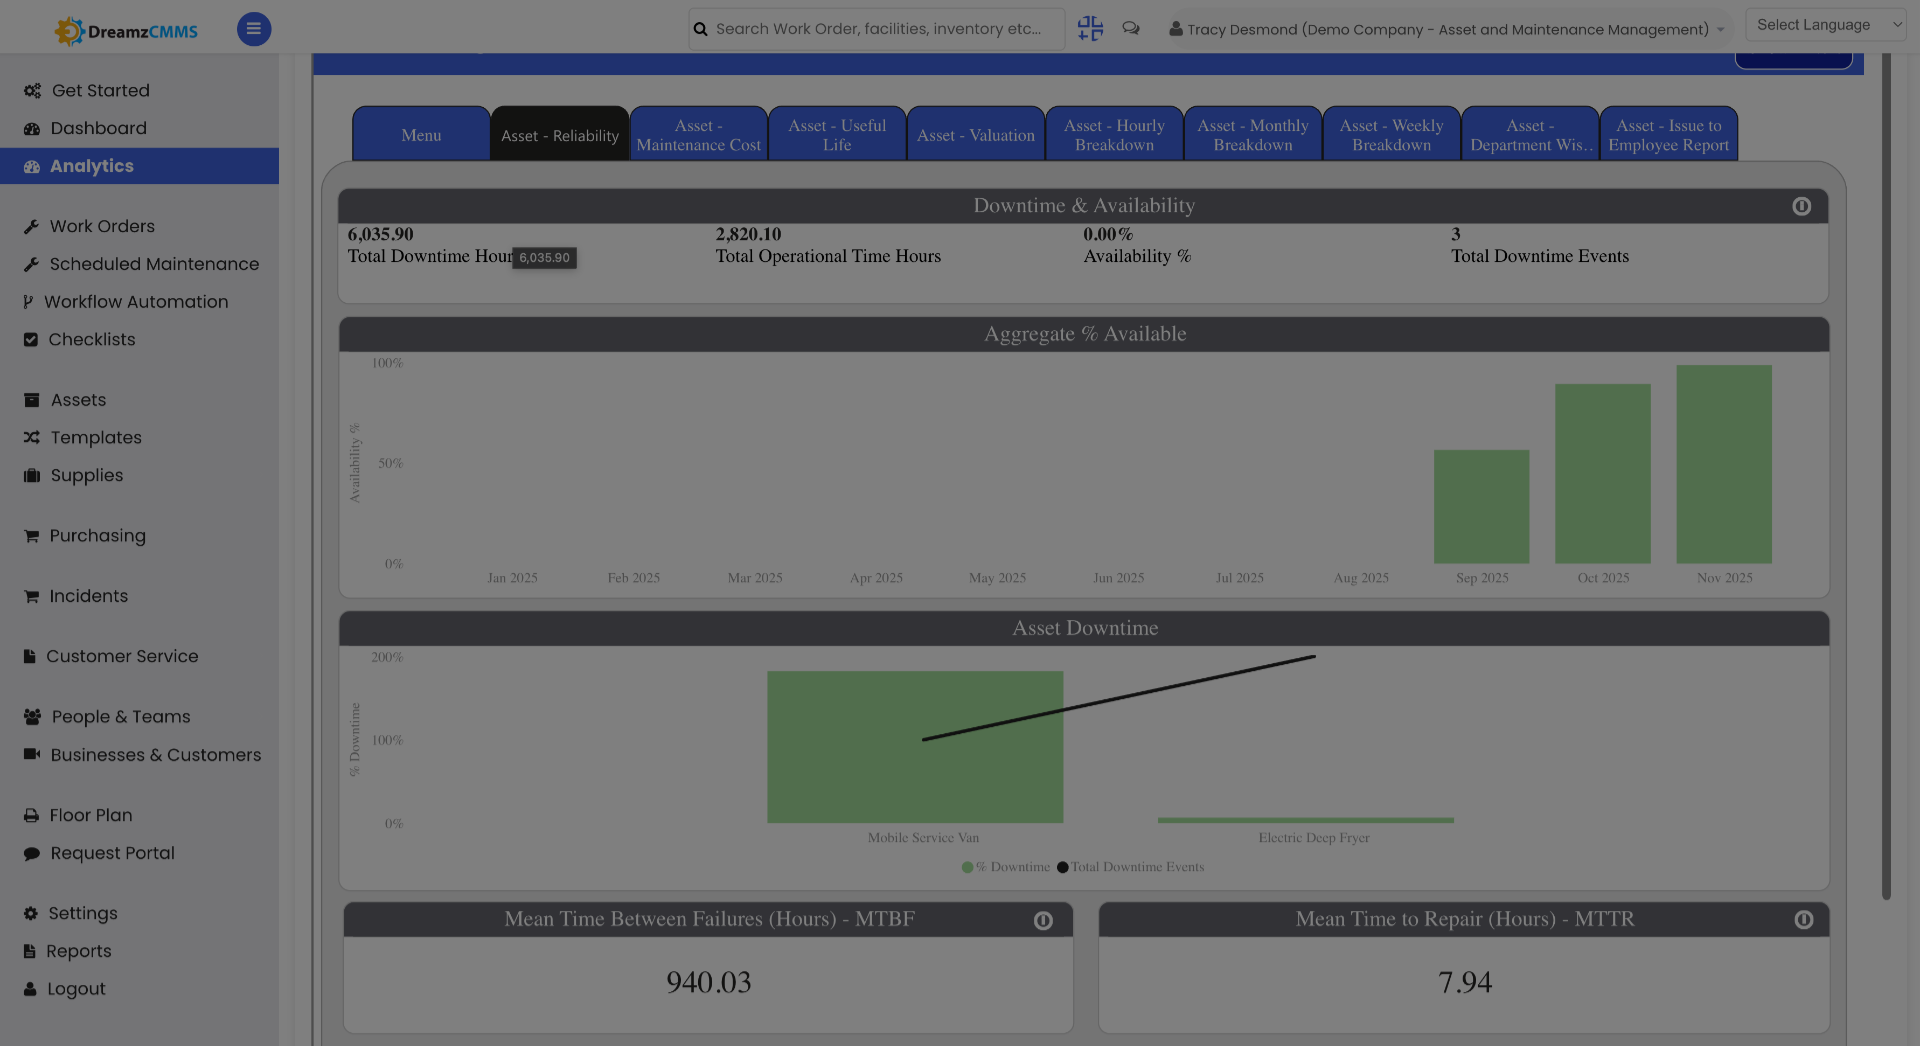
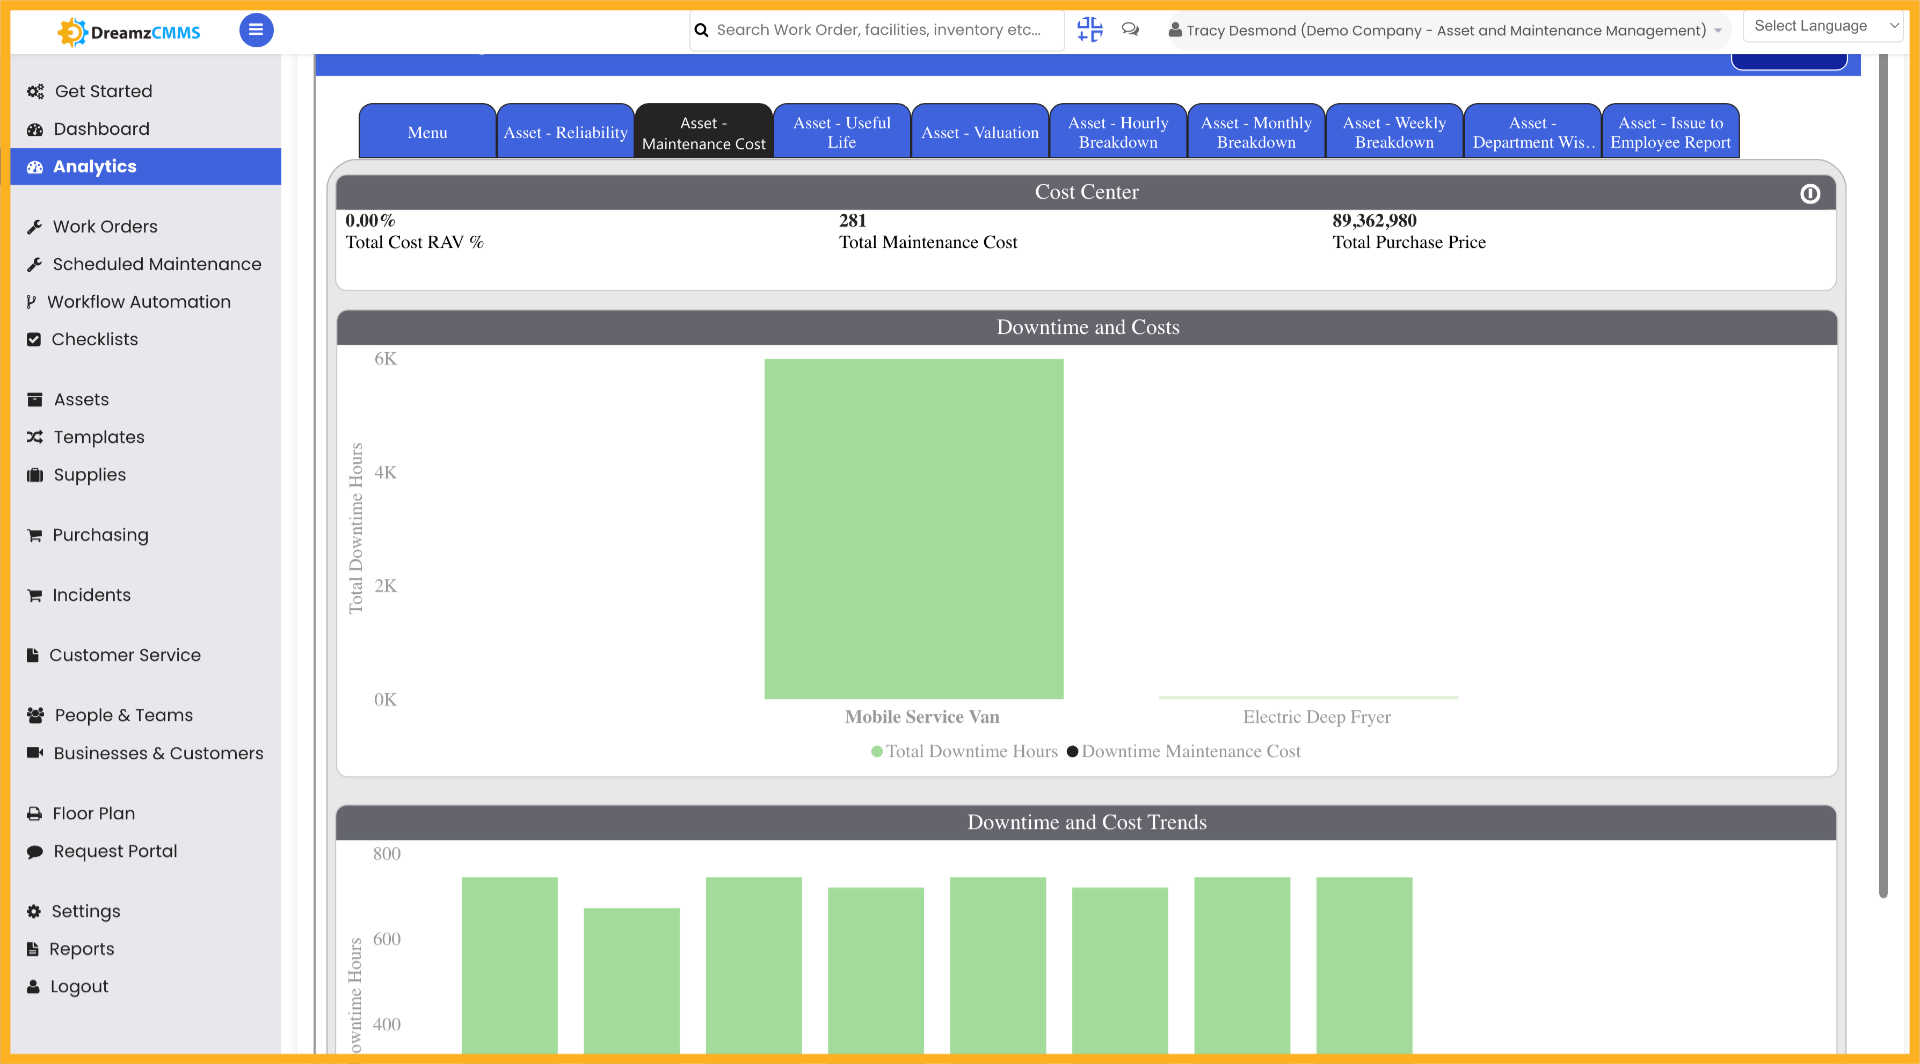
Step 04 – Access Assets Menu
Click the Assets menu to view all available analytics resources related to your assets.
Step 05 – Select Date Filter
Select the date filter to narrow down your asset-related data to a specific time period.
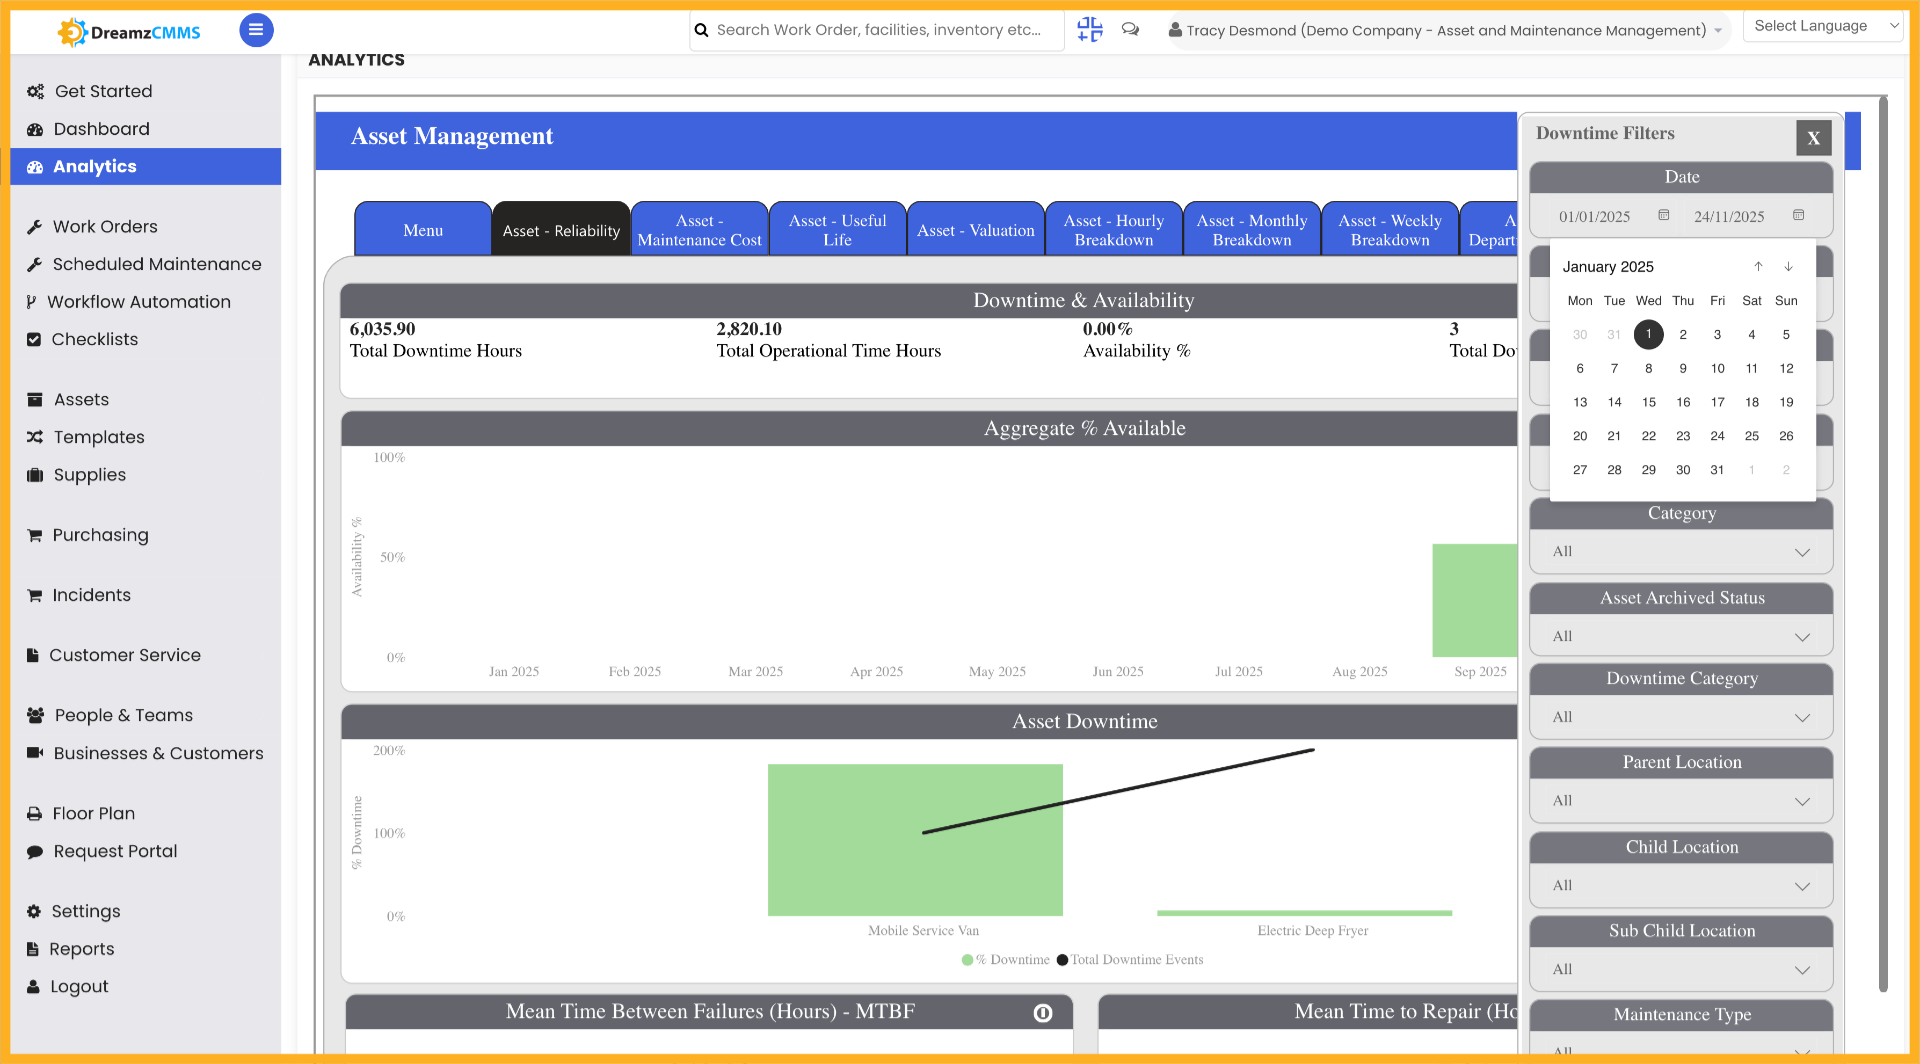
Step 06 – Select Date Range
Select the date range to see asset-related data for a particular date range of your choosing.
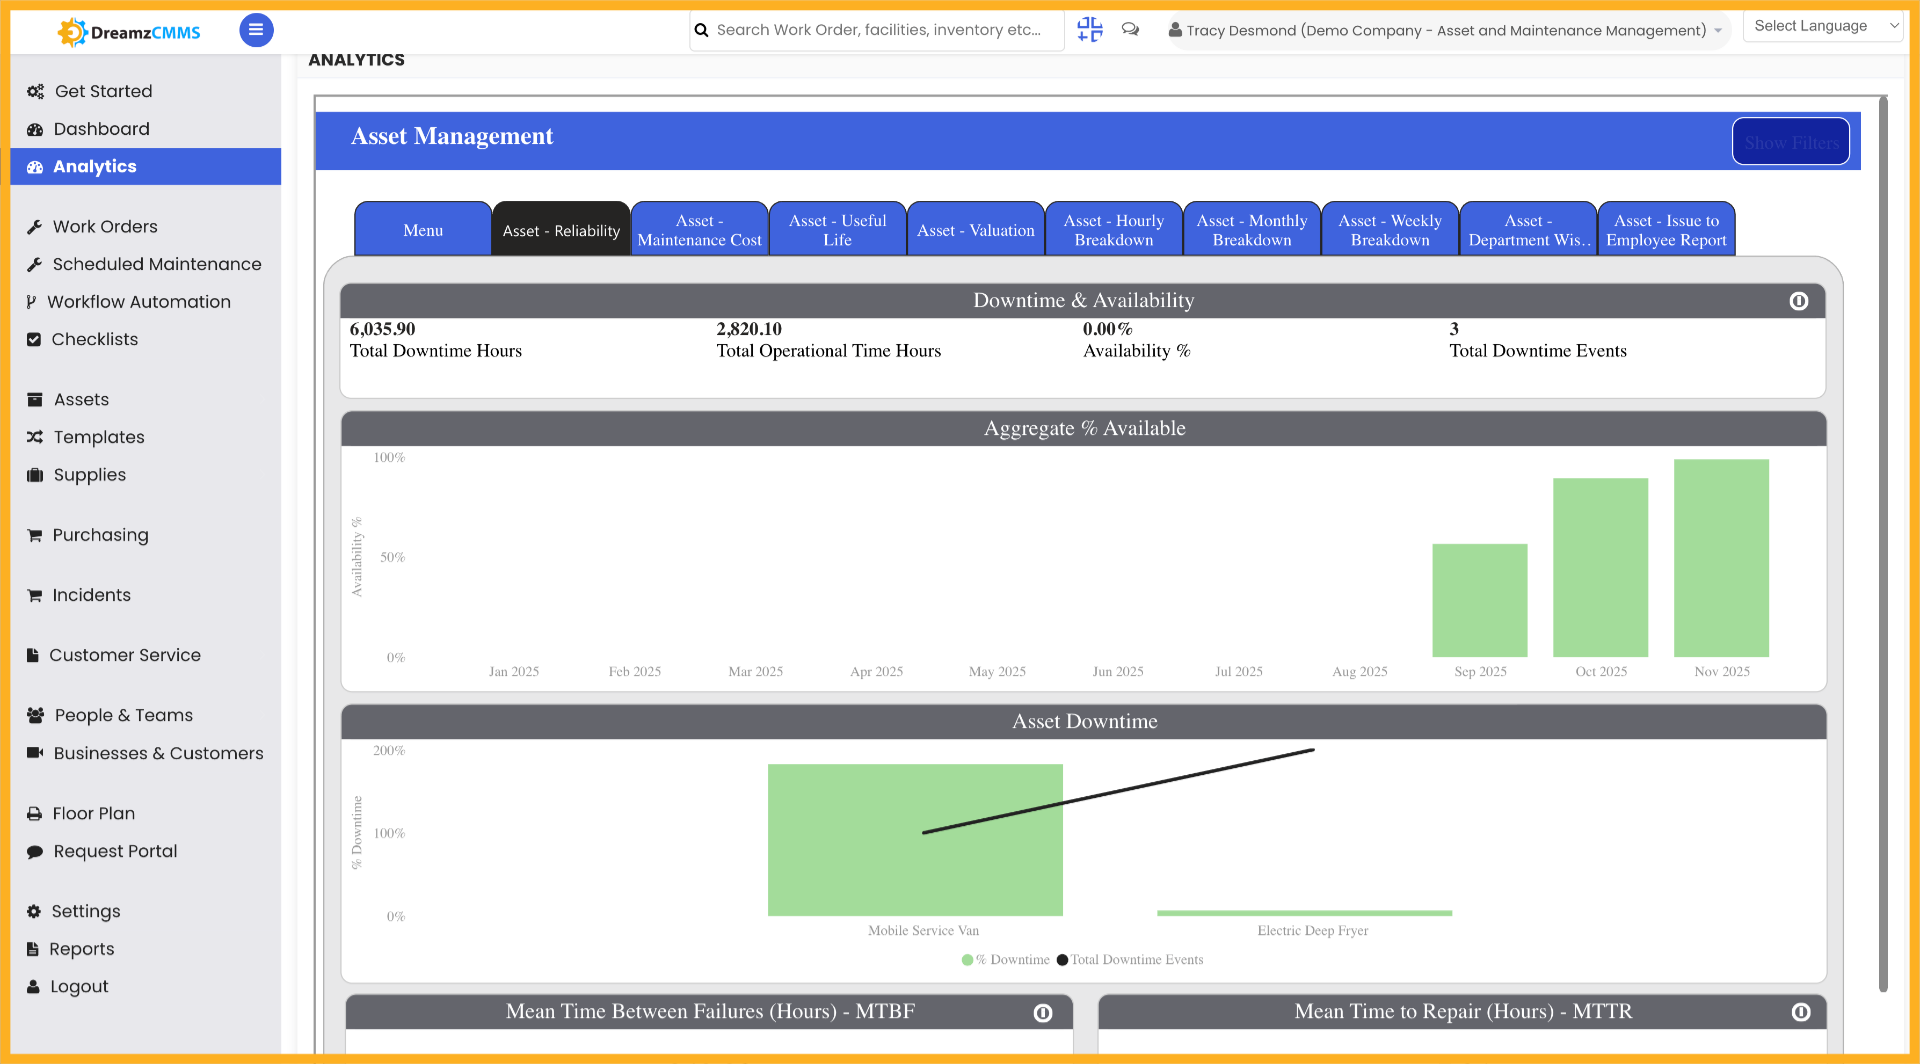
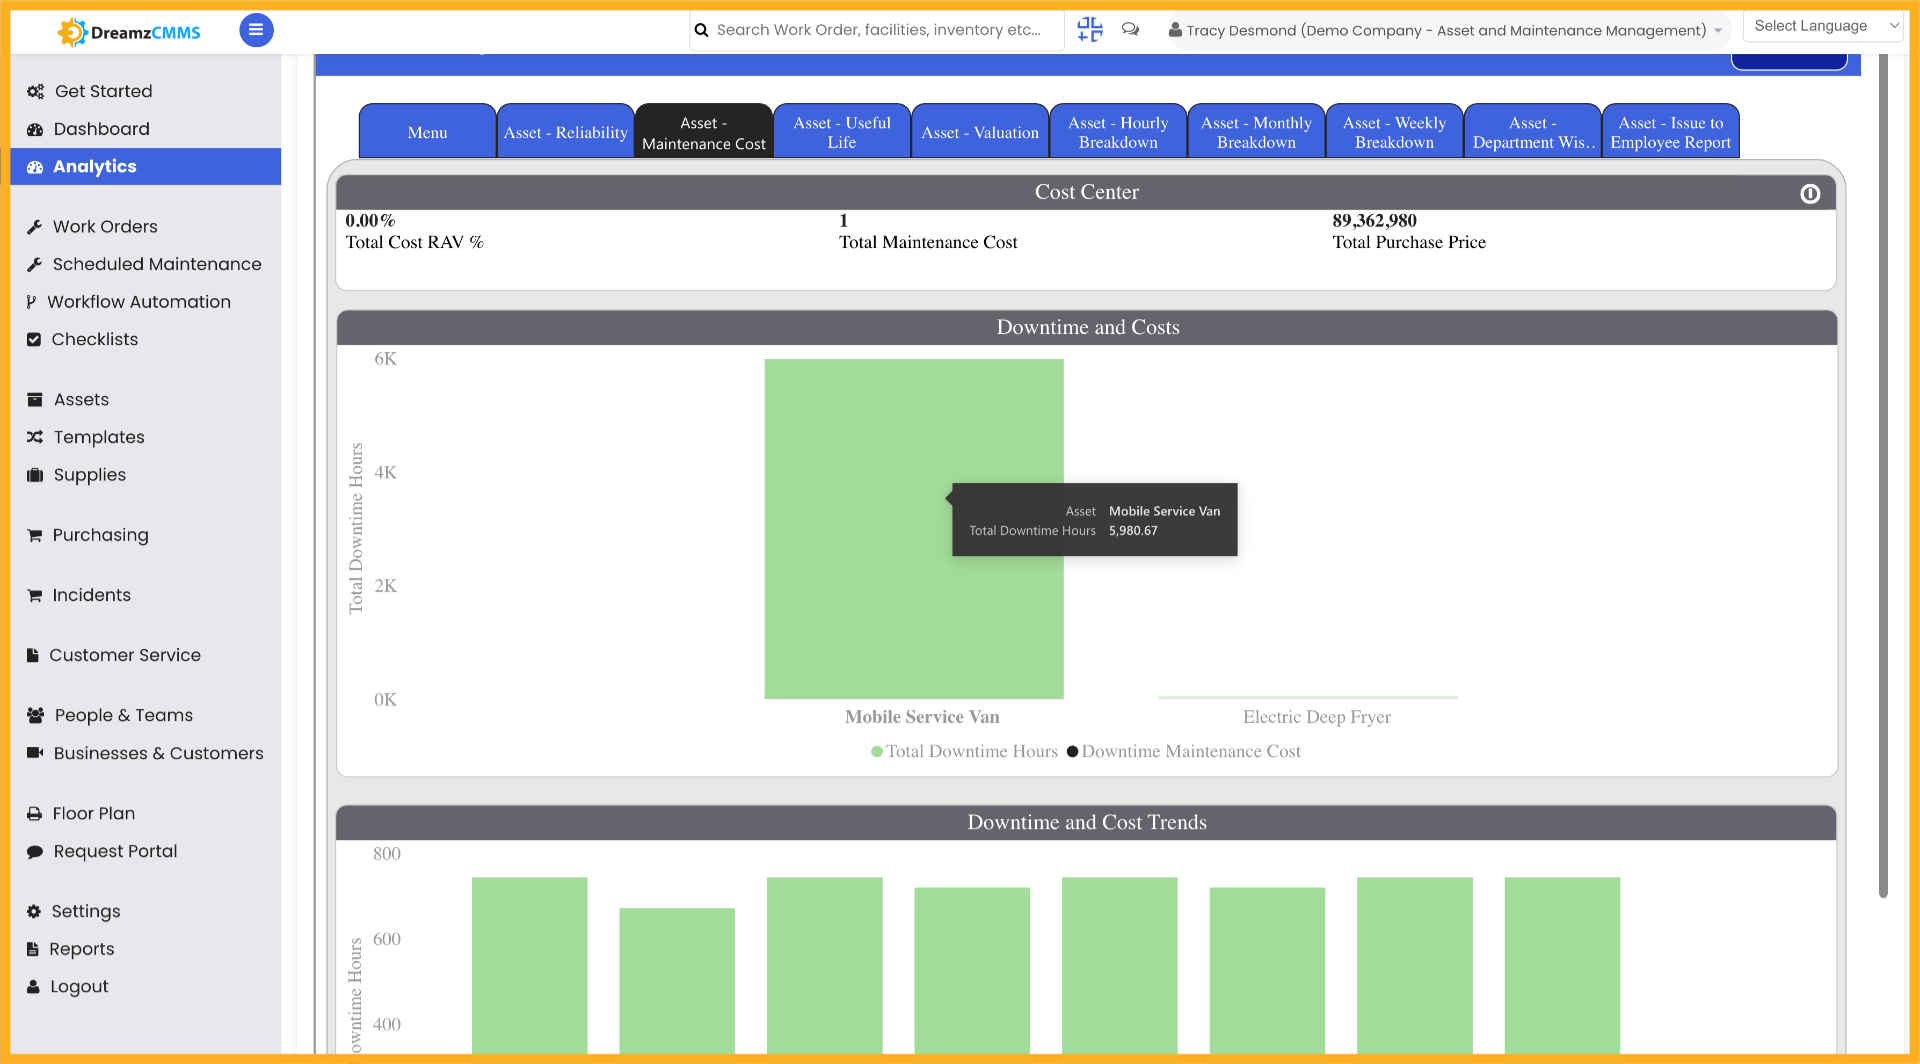
Step 07 – Click on an Asset to See Data
Click on a specific asset to see all data related to that particular asset in detail.
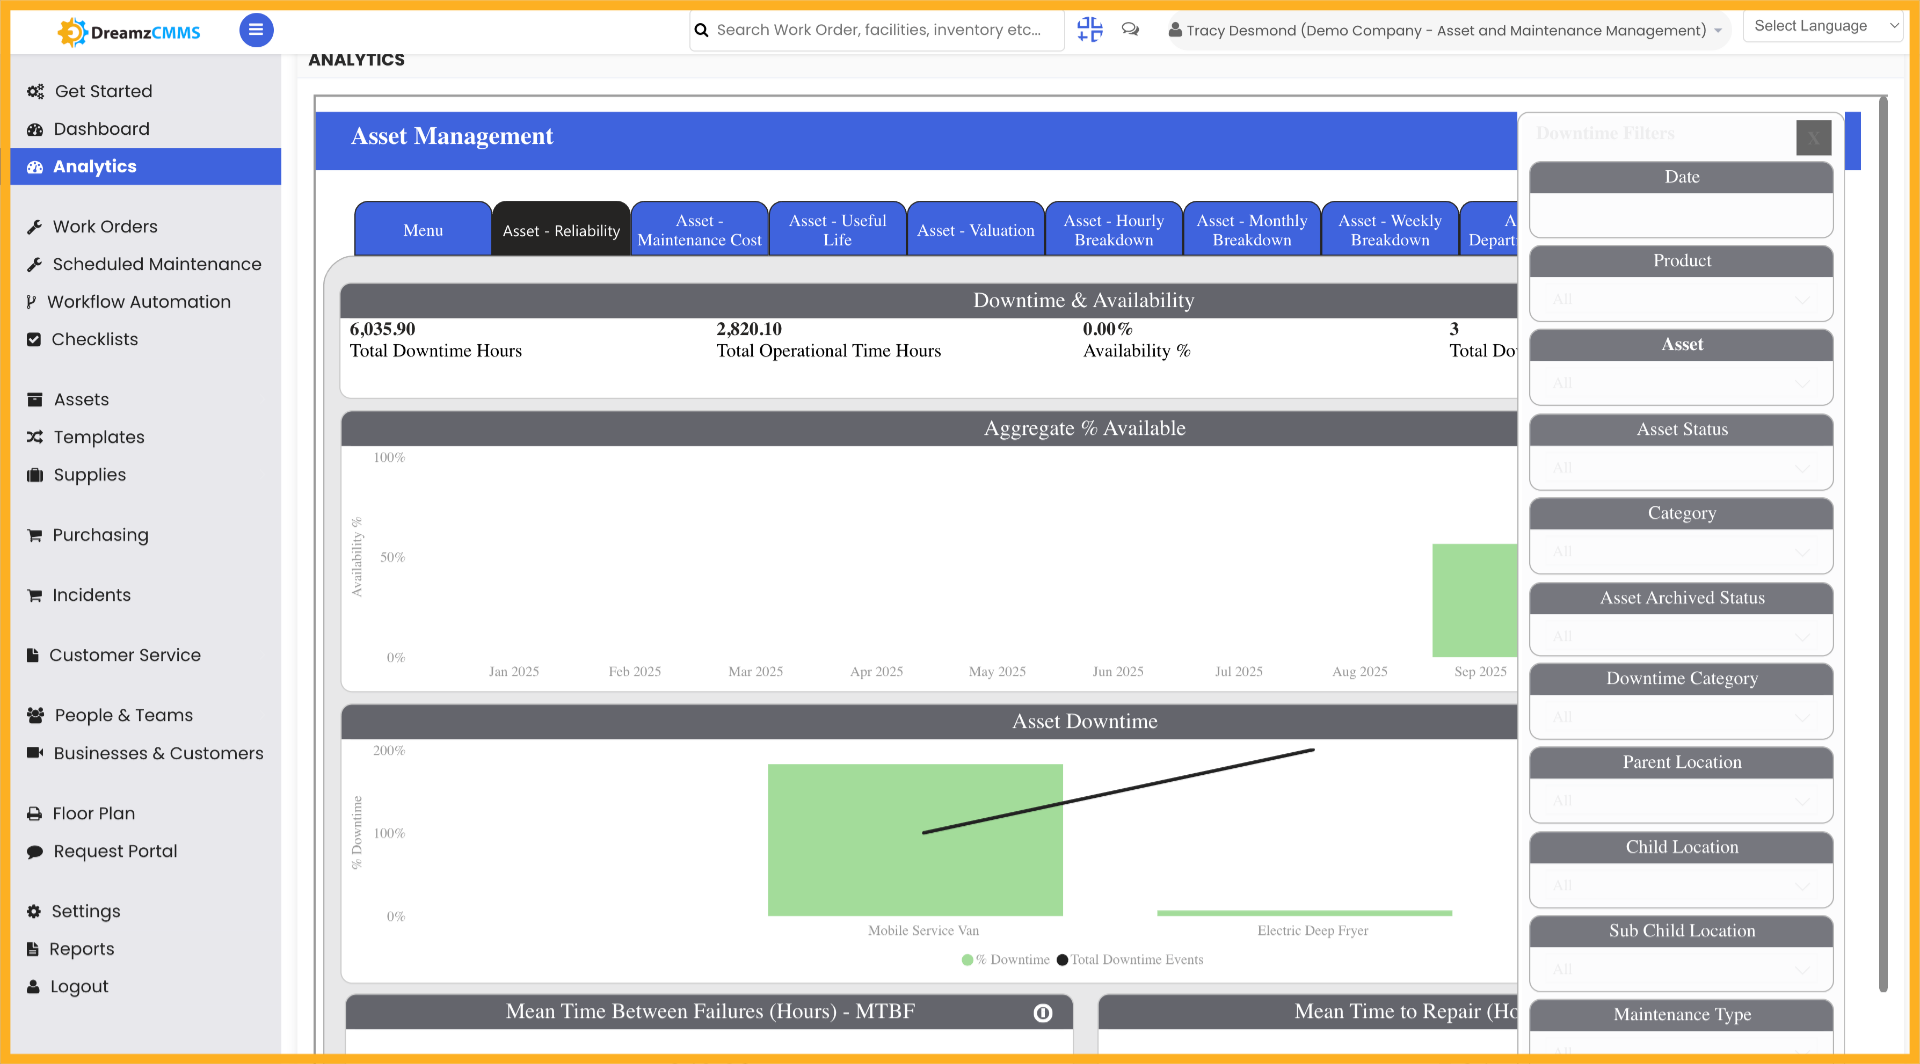
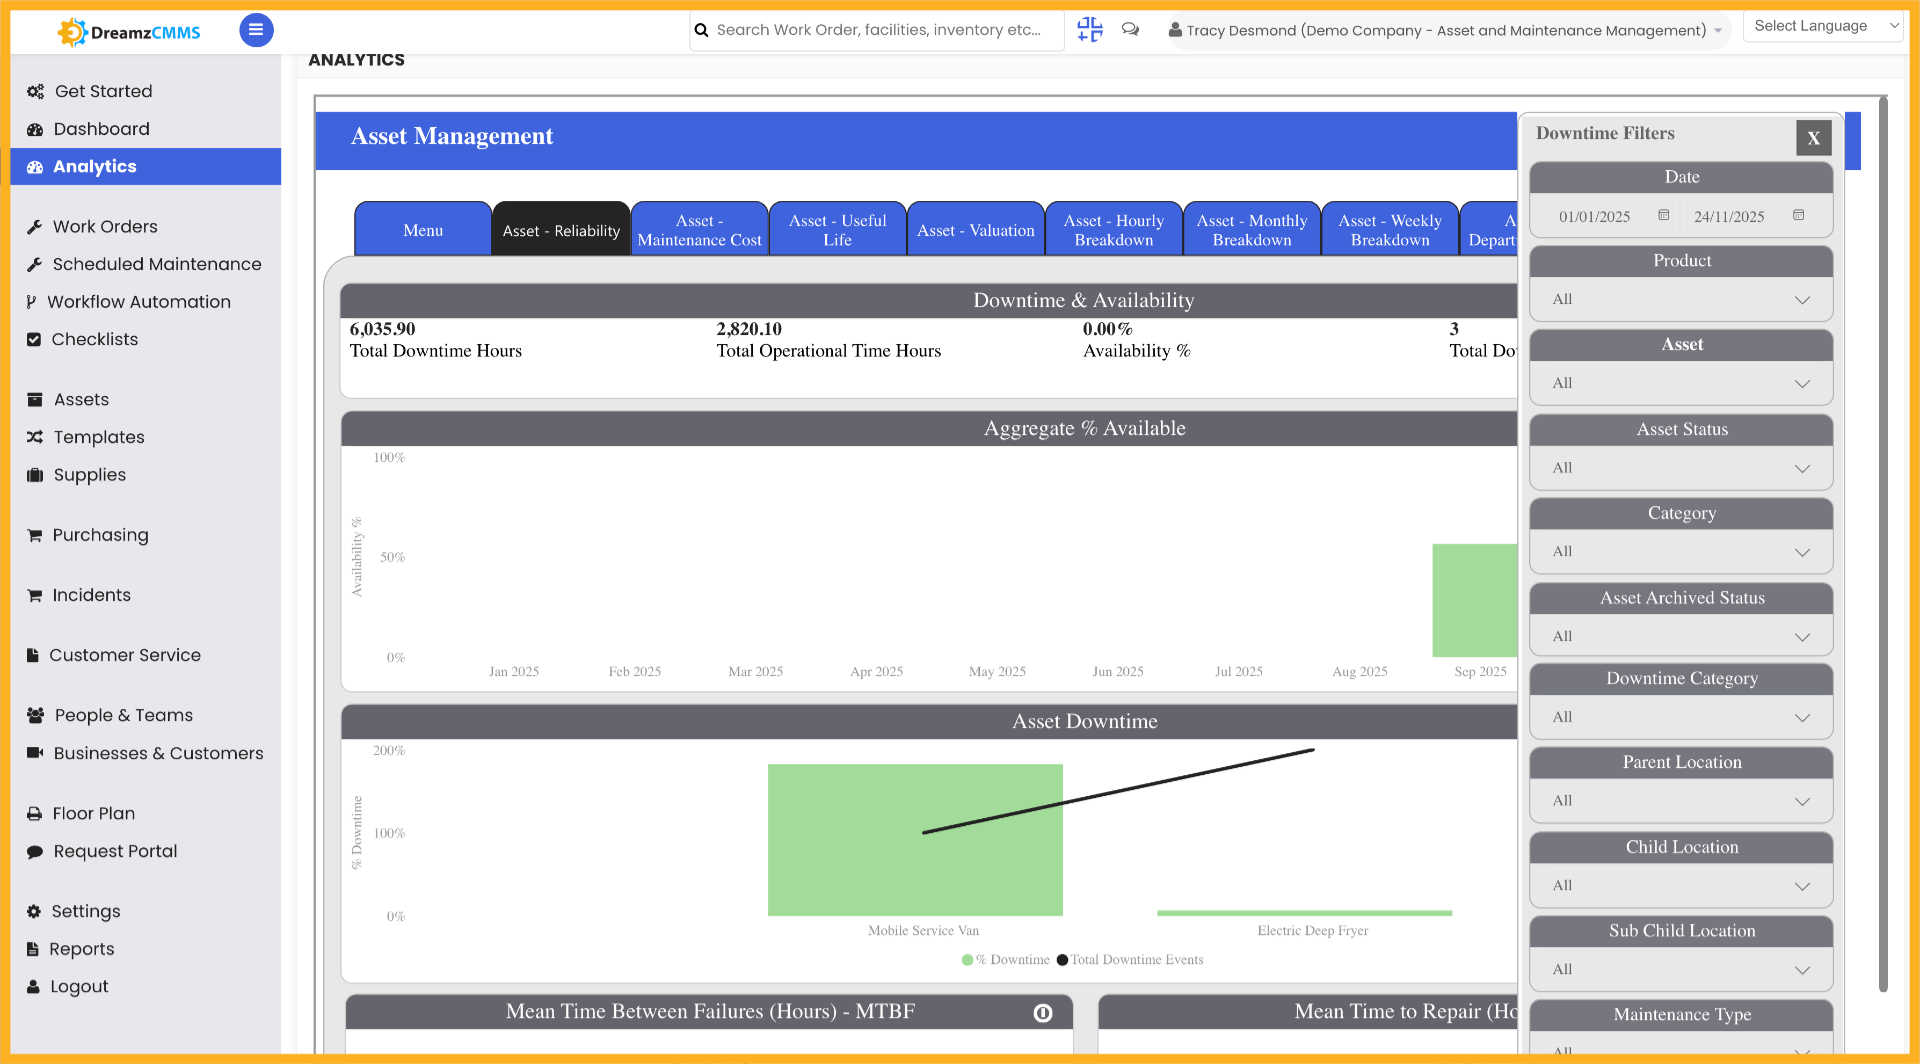
Step 08 – Navigate to Asset Filters
Click the Filters tab to apply criteria that refine your asset data and focus the report on relevant results.
Step 09 – Apply Filter Criteria
Click to select filter criteria that focus the analytics on relevant data points for your analysis.
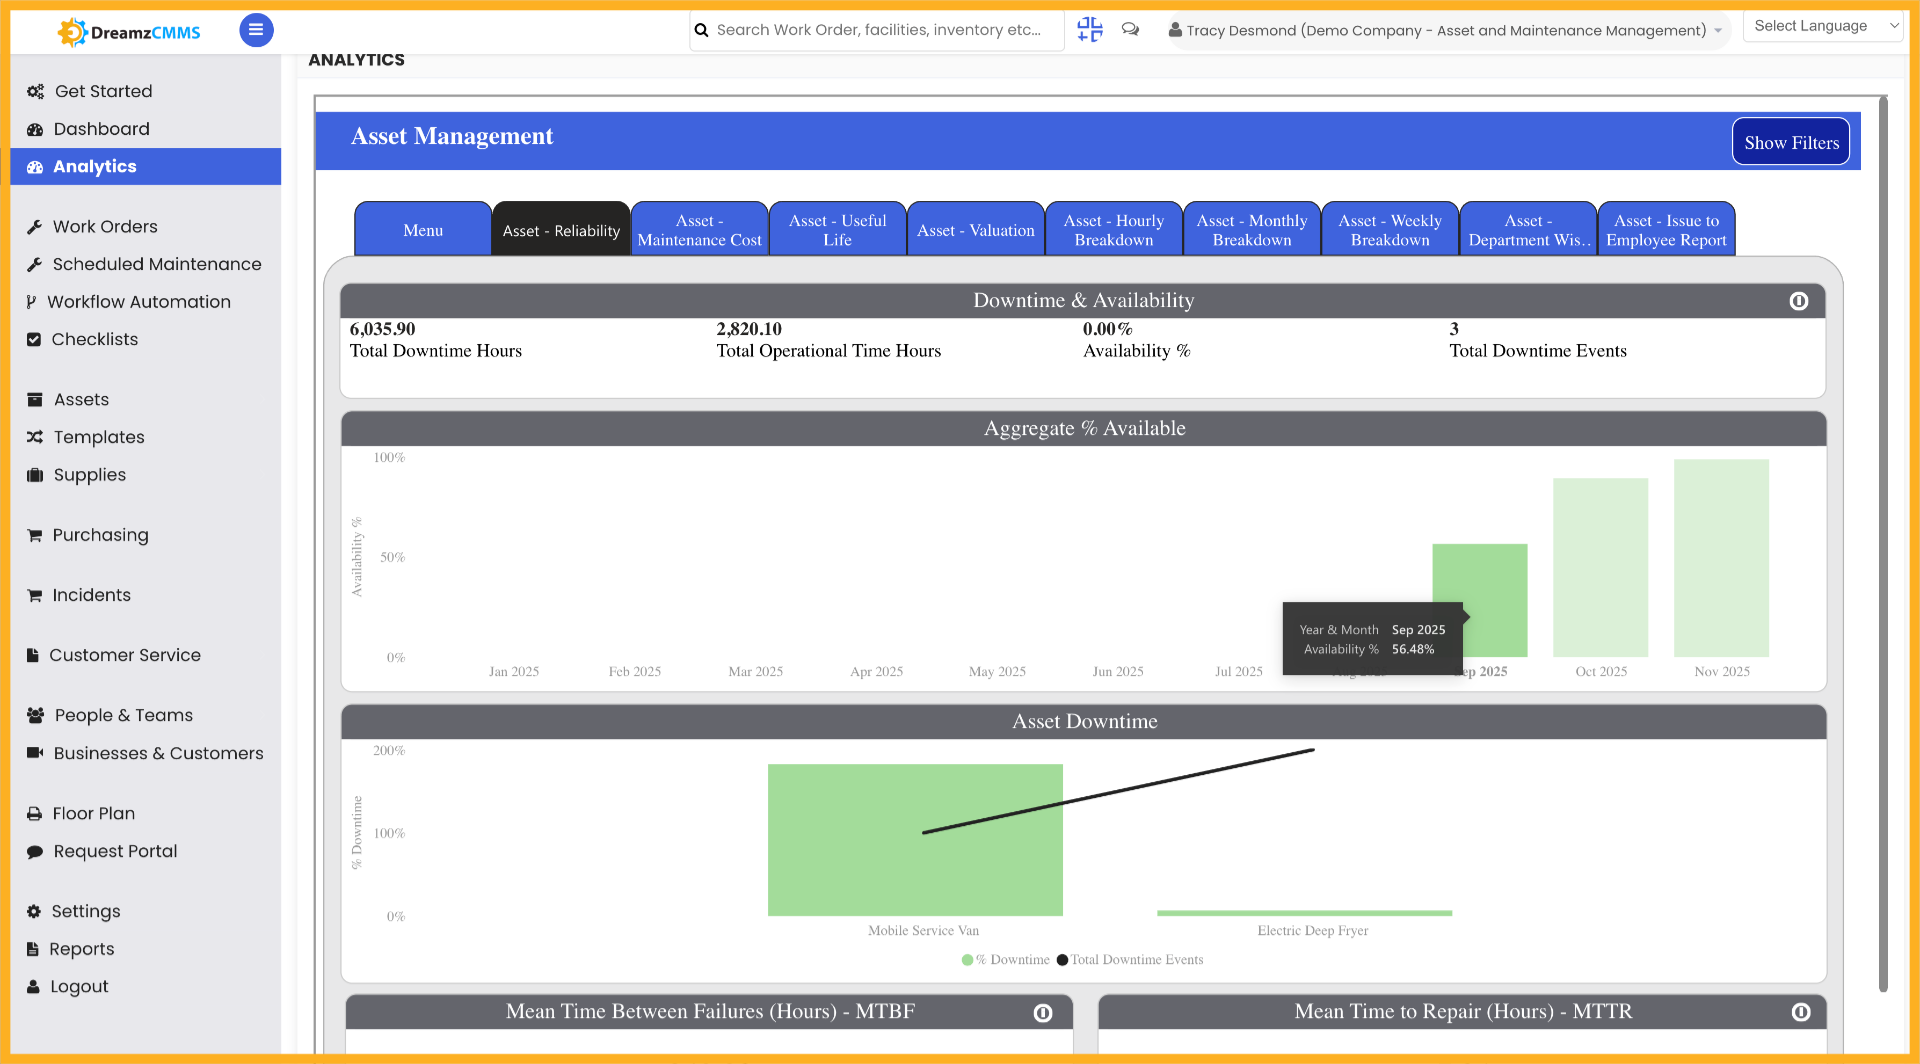
Step 10 – Access Asset Visualization
Click the Visualization tab to customise how asset data is displayed in your report.
Step 11 – Modify Visualization Settings
Click to adjust the visualization settings for better data representation tailored to your reporting needs.
Step 12 – Select Asset Named Parts Tumbler
Click Parts Tumbler to choose this specific asset for detailed analysis.
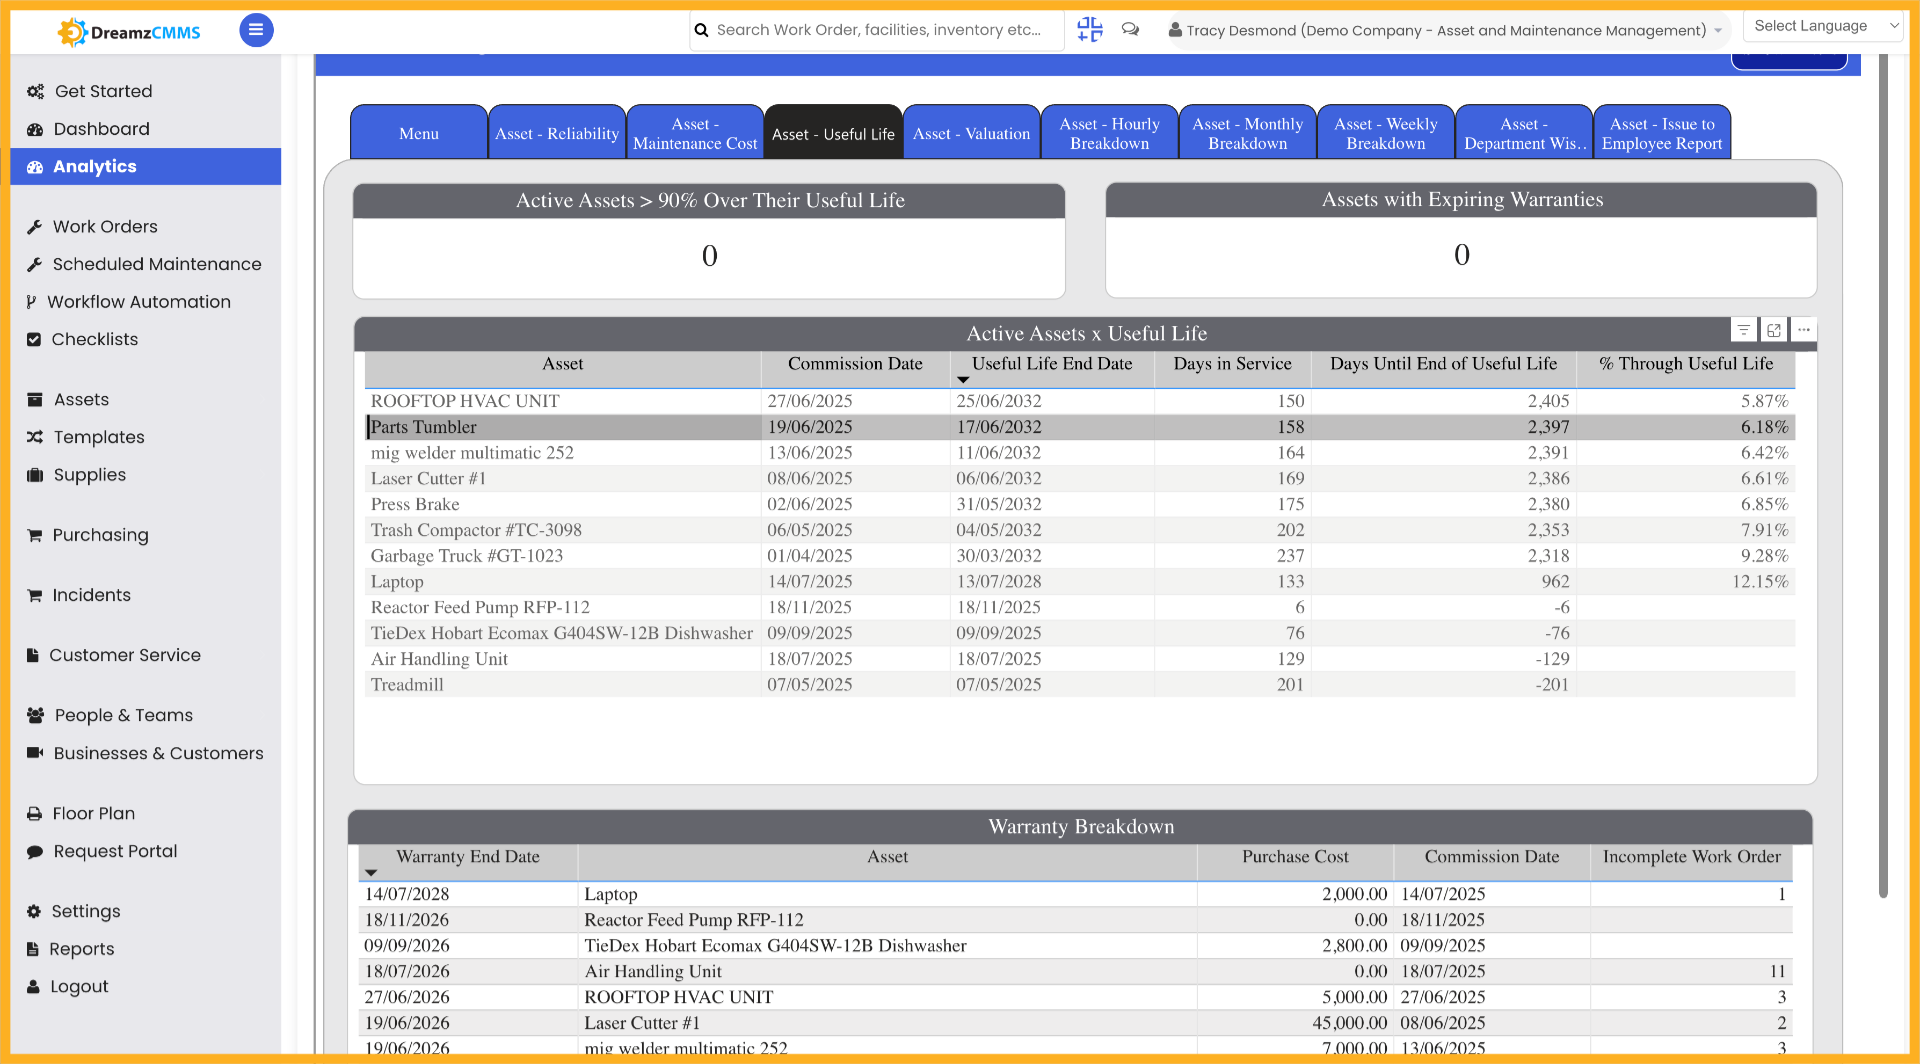
Step 13 – Confirm Parts Tumbler Selection
Click Parts Tumbler again to confirm your selection and proceed with the detailed analysis for this asset.
Tips for Using the Asset Analytics Report
- Use the Asset Reliability section to monitor which assets are performing well and which may need preventive maintenance based on reliability trends.
- Apply the date filter to narrow your analytics to a specific time period, making it easier to compare asset performance across different months or quarters.
- Click on a specific asset from the list to drill into its individual data, giving you a granular view of that asset’s activity, maintenance history, and performance metrics.
- Use the Filters tab to apply targeted criteria that refine your analytics view and remove irrelevant data, making your reports more precise and actionable.
- Customise the Visualization settings to display asset data in the format that best suits your team’s reporting or presentation requirements.
Frequently Asked Questions
How do I access the Analytics Reports for Assets in DreamzCMMS?
Navigate to the Analytics section in DreamzCMMS and click on the Analytics section to begin. From there, select Asset Reliability to view asset-related analytics data.
Can I filter the asset analytics data by date?
Yes. Use the date filter to narrow down your asset-related data to a specific time period, and then select a date range to view asset data for that particular period.
How do I view data for a specific asset?
From the asset list in the analytics section, click on the specific asset you want to analyse. This will display all data related to that particular asset in detail.
What can I do with the Filters tab in asset analytics?
The Filters tab allows you to apply specific criteria to refine the data shown in your analytics report, helping you focus on the most relevant assets and data points for your analysis.
How do I customise how asset data is displayed in the report?
Click the Visualization tab to access visualisation settings, then adjust the settings to customise how asset data is displayed. This allows you to tailor the report layout and format to suit your specific needs.
Related Articles
- Analytics Report for FSM
- Analytics Report for Request
- FSM Dashboard View
- How to Create Jobs
- Plan Routes & Assign Jobs