FSM Dashboard View
The dashboard provides a comprehensive snapshot of day-to-day business performance, helping users quickly understand job activity, financial status, upcoming schedules, and overall operational health. It brings together all essential metrics into a single, easy-to-navigate view.
Overview
The FSM Dashboard in DreamzCMMS serves as the central hub for monitoring your field service operations. Upon login, users are presented with a real-time view of key metrics including open estimations, unassigned jobs, pending invoices, and active service plans. The dashboard also features job trend charts, job type distributions, estimation activity, invoice performance, and a map view of today’s scheduled jobs — all designed to help users monitor operations and performance at a glance.
Here is a reference video:
Step by Step Description to View the Dashboard
Step 1 – Land on the Dashboard
After you login to the FSM system you will land on the Dashboard.
Step 2 – Key Business Metrics Overview
This dashboard gives a quick snapshot of key business metrics, including open estimations, unassigned jobs, pending invoices, and active service plans. It also highlights upcoming jobs, job trends over the last five months, job types, and financial insights such as invoice status and total paid amounts — helping users monitor operations and performance at a glance.

Step 3 – Summary Cards (Estimations, Jobs, Invoices, Service Plans)
Estimation shows the total number and value of open estimations that are pending customer approval, helping track potential upcoming jobs and revenue. Job displays the count of unassigned jobs that require technician assignment, ensuring no pending tasks are overlooked in the workflow. Invoices highlights the number and total value of open invoices that are yet to be paid, giving quick insight into outstanding receivables. Service Plans provides the count and value of active service agreements, helping monitor recurring service commitments and contract-based revenue.

Step 4 – Upcoming Scheduled Jobs
Displays the scheduled jobs that are planned for future dates, including their time, date, and job IDs. This section helps users quickly see the next set of appointments or tasks that need attention.

Step 5 – Job Trend Chart (Last 5 Months)
This chart shows the job trend over the last five months, comparing the number of jobs completed with the total job value. It highlights monthly fluctuations in workload, giving managers a clear picture of activity levels over time.

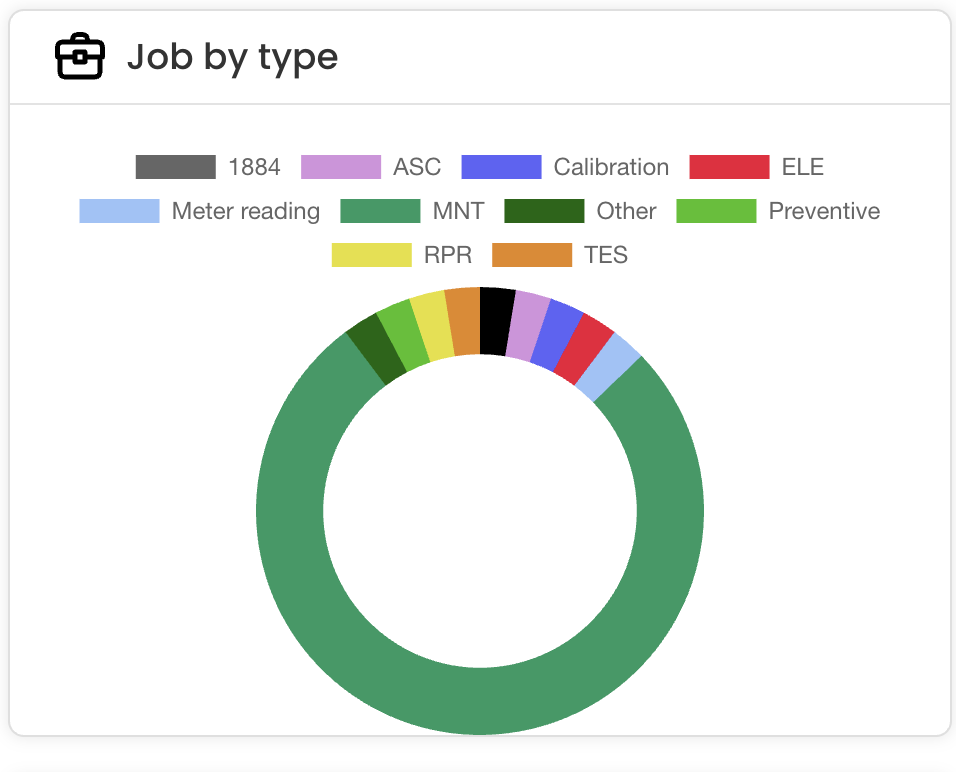
Step 6 – Job Type Distribution Chart
This chart shows the distribution of jobs by type, highlighting which service categories are most frequently performed. This helps teams understand demand patterns across different service offerings.
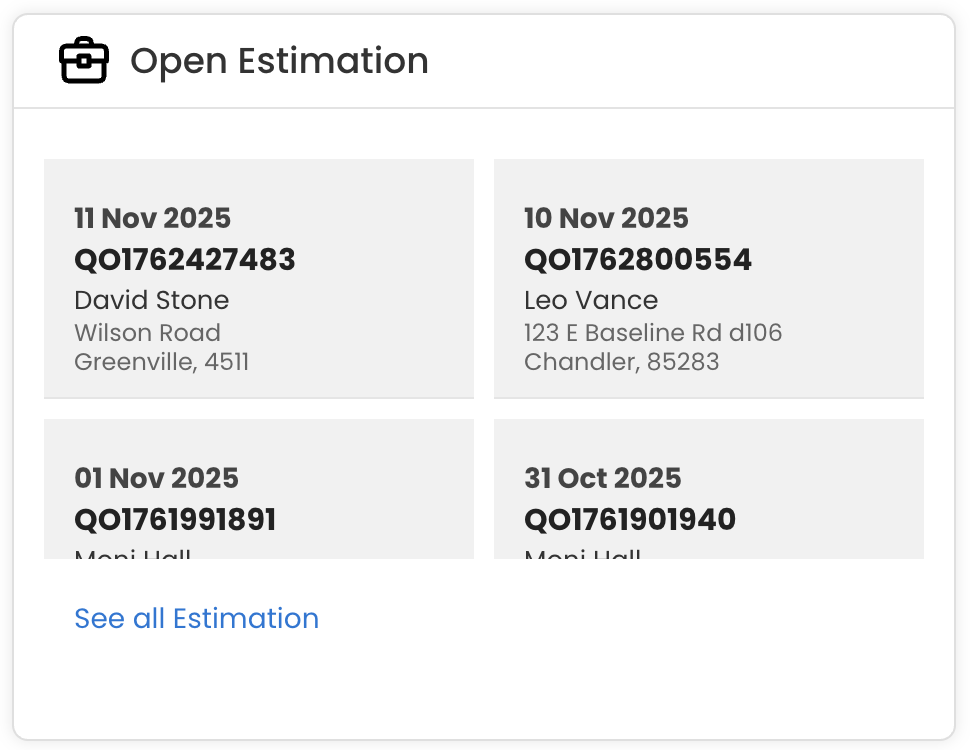
Step 7 – Active Estimations Awaiting Approval
This section lists all active estimations that are awaiting customer approval. It displays the estimation date, reference number, and customer details, helping users quickly identify pending quotes that need follow-up.
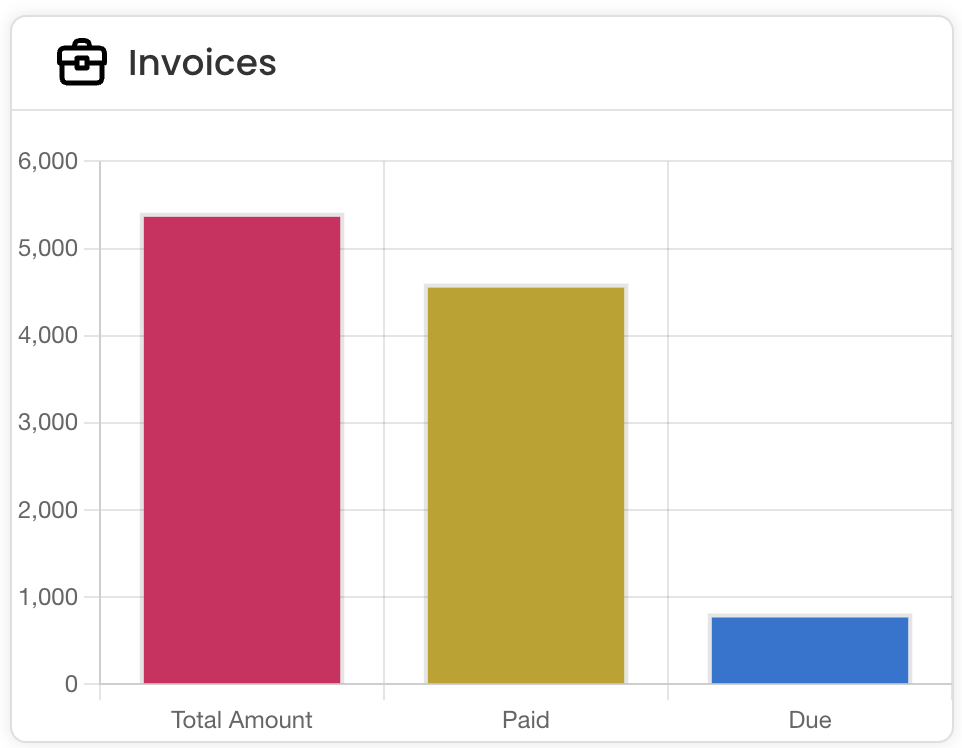
Step 8 – Invoice Performance Bar Chart
This bar chart compares the total invoice amount with the amounts paid and still due. It provides a quick overview of overall billing performance, showing how much revenue has been collected versus how much remains outstanding.
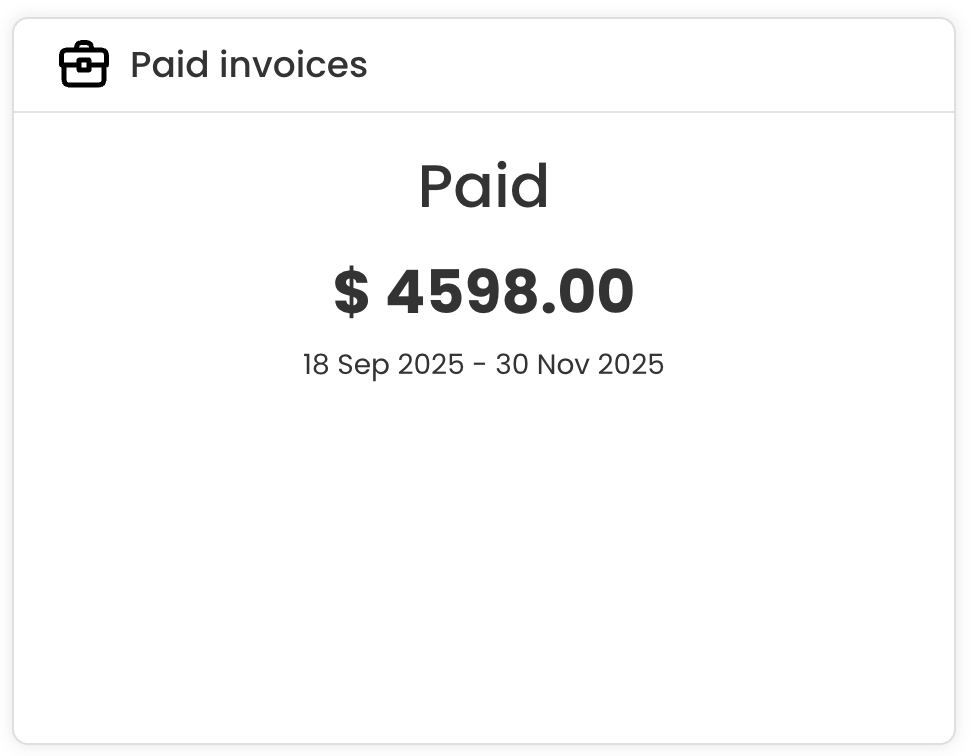
Step 9 – Total Paid Invoices
This section highlights the total amount received from paid invoices during the selected date range, giving a quick view of confirmed revenue collected.
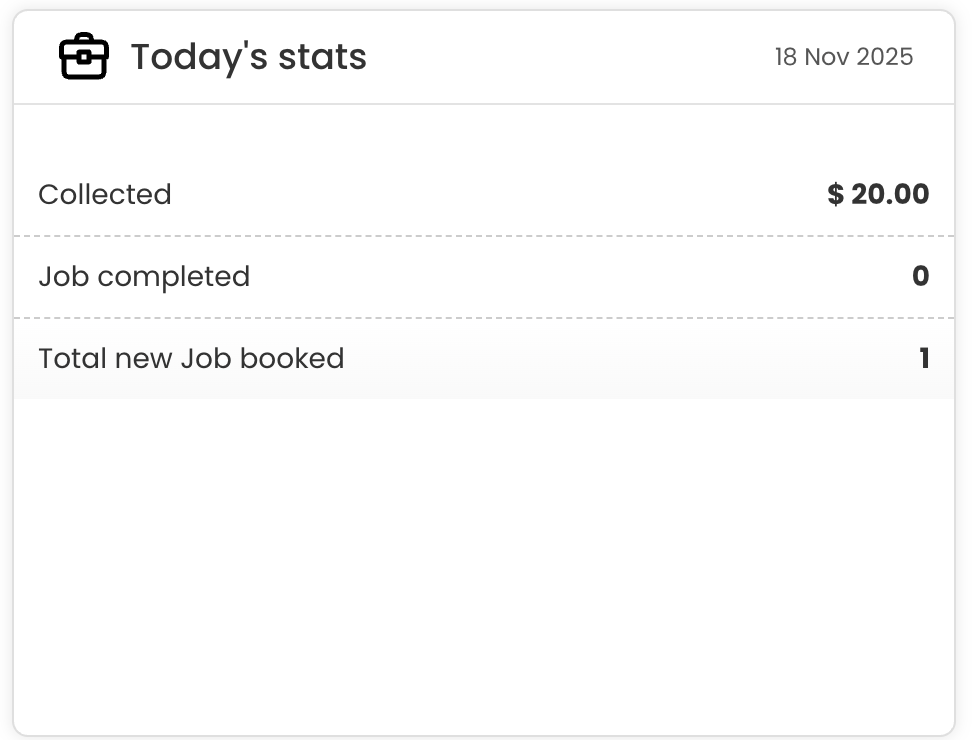
Step 10 – Today’s Performance Summary
This section provides a quick summary of today’s performance, showing the amount collected, the number of jobs completed, and the total new jobs booked on the current date.
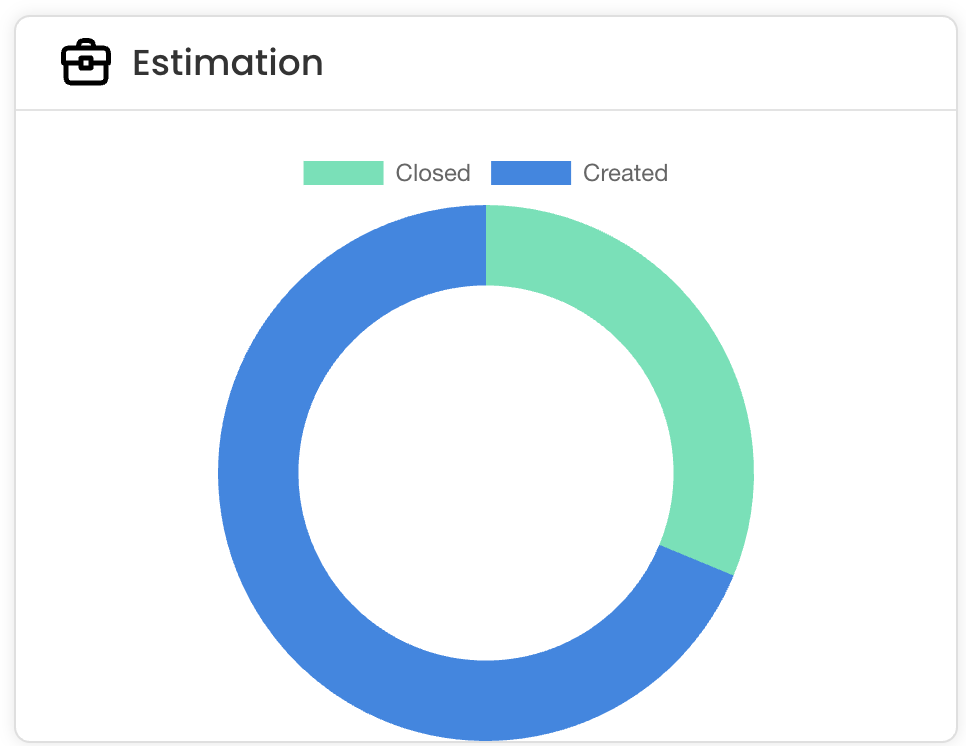
Step 11 – Estimation Activity Donut Chart
This donut chart compares the number of estimations created versus closed within the selected period, giving a quick view of overall estimation activity and follow-through.
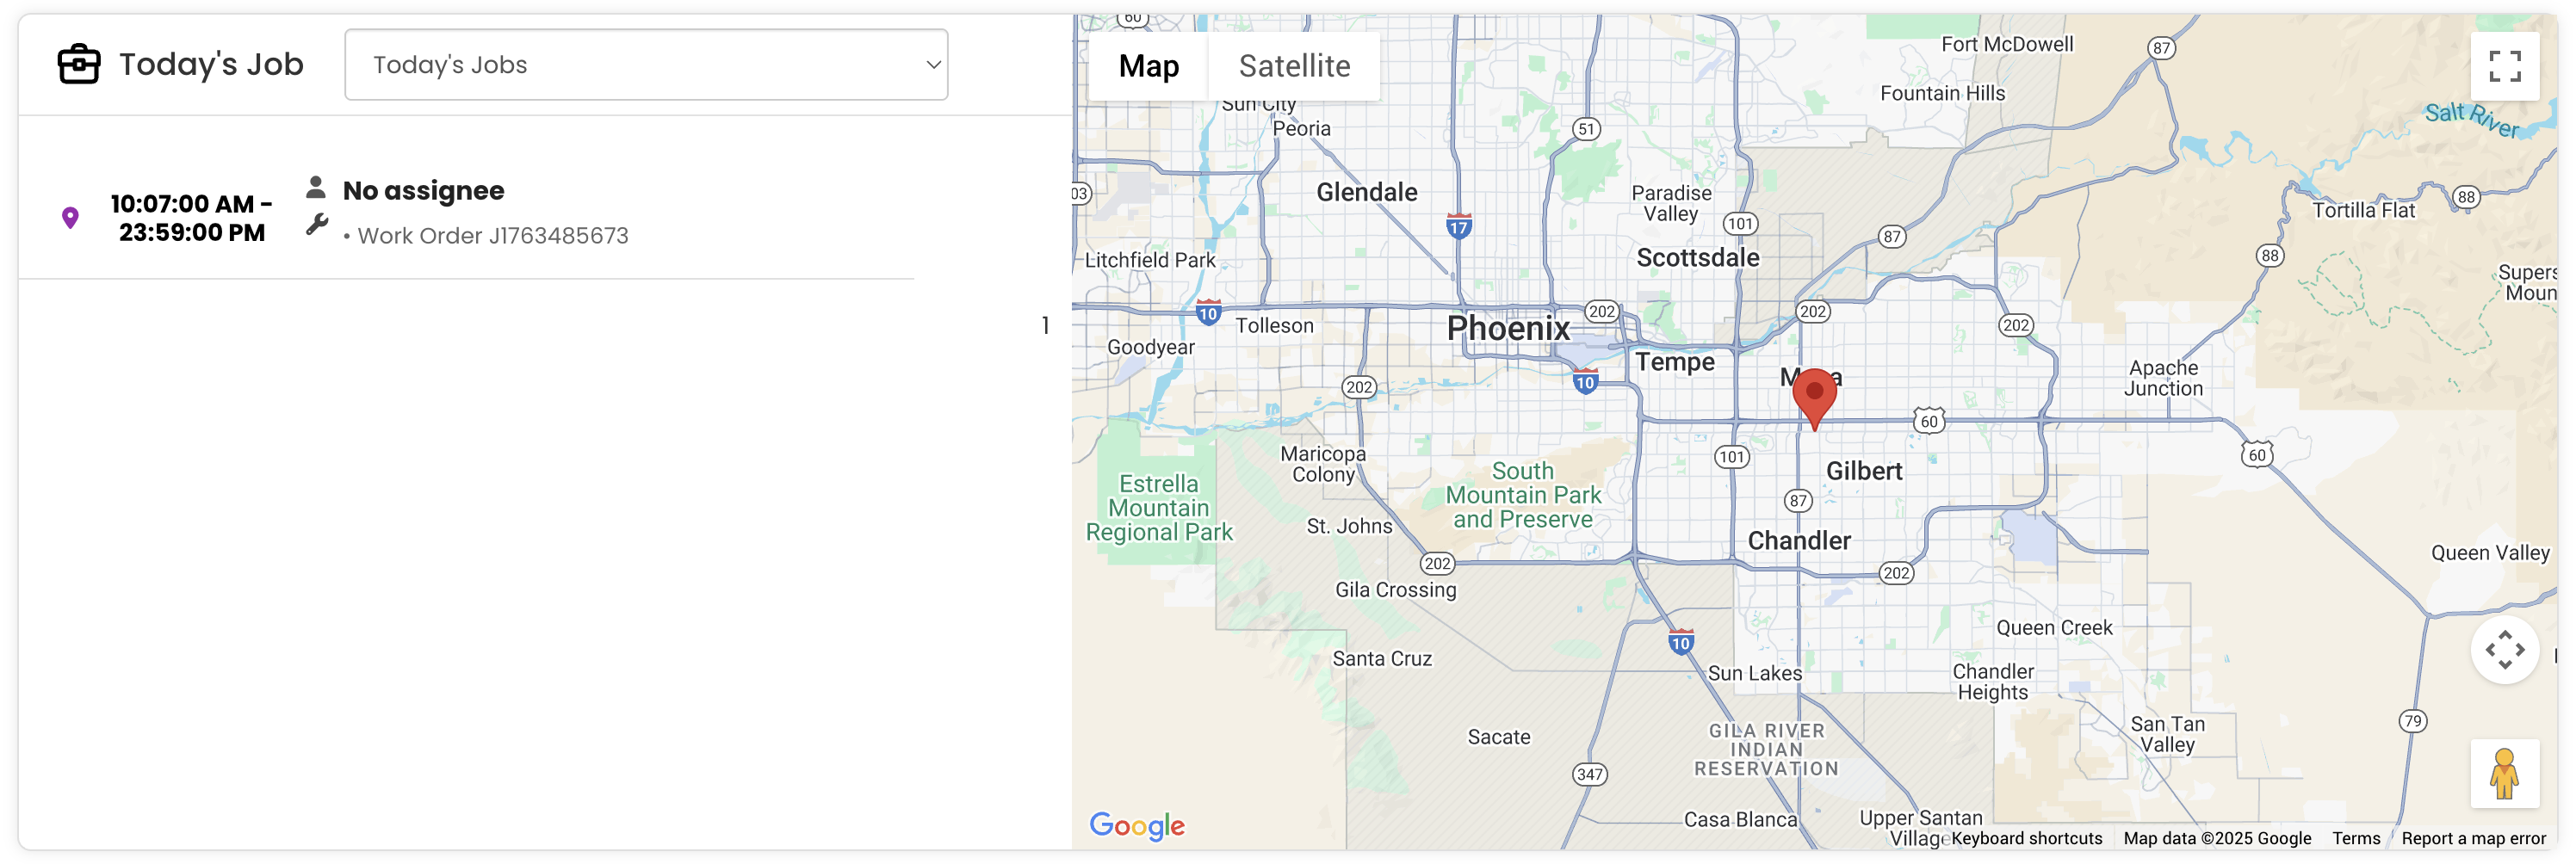
Step 12 – Today’s Jobs with Map View
This section displays the jobs scheduled for today along with their timings, work order details, and assigned technicians. It also includes a map view showing the job location for easy navigation and planning.
Tips for Using the FSM Dashboard
- Review the Summary Cards (Estimations, Jobs, Invoices, Service Plans) at the start of each day to get an immediate picture of workload and outstanding financial items that require action.
- Use the Upcoming Scheduled Jobs section to plan your team’s day in advance and ensure all appointments are covered with the right technicians assigned.
- Monitor the Job Trend Chart regularly to identify patterns in workload volume over the past five months and use this data to plan resourcing and capacity.
- Check the Invoice Performance Bar Chart to stay on top of outstanding receivables and take prompt follow-up action on unpaid invoices to maintain healthy cash flow.
- Use the Today’s Jobs Map View to quickly visualise job locations and help technicians plan efficient travel routes throughout the day.
Frequently Asked Questions
What is the FSM Dashboard and where do I find it?
The FSM Dashboard is the main landing page you see after logging into the DreamzCMMS FSM system. It provides a comprehensive overview of your field service operations, including jobs, invoices, estimations, and service plans, all in one view.
What information do the Summary Cards show?
The Summary Cards display four key metrics: Estimation (open estimations pending approval), Job (unassigned jobs awaiting technician assignment), Invoices (open invoices yet to be paid), and Service Plans (active service agreements). Each card shows both the count and total value for each category.
What does the Job Trend Chart show?
The Job Trend Chart displays job activity over the last five months, comparing the number of completed jobs against total job value. It highlights monthly fluctuations in workload so managers can identify trends and plan resources accordingly.
How can I see today’s scheduled jobs on the dashboard?
The Today’s Jobs section at the bottom of the dashboard displays all jobs scheduled for the current date, including their timings, work order details, and assigned technicians. A map view is also included to show job locations for easy planning and navigation.
Can I view estimation activity from the dashboard?
Yes. The Active Estimations section lists all estimations awaiting customer approval with their dates and reference numbers, and the Estimation Activity Donut Chart compares the number of estimations created versus closed within the selected period.
Related Articles
- Analytics Report for FSM
- Analytics Report for Request
- Schedule Jobs and Kanban View
- How to Create Jobs
- Plan Routes & Assign Jobs